
NWS DATA
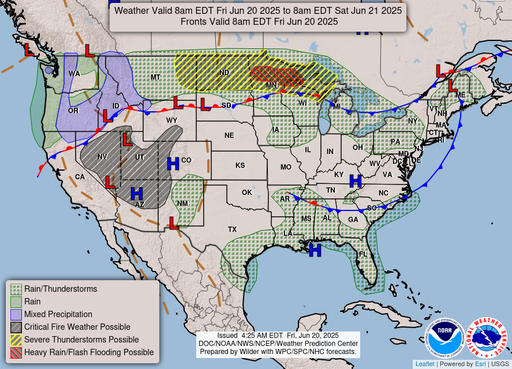
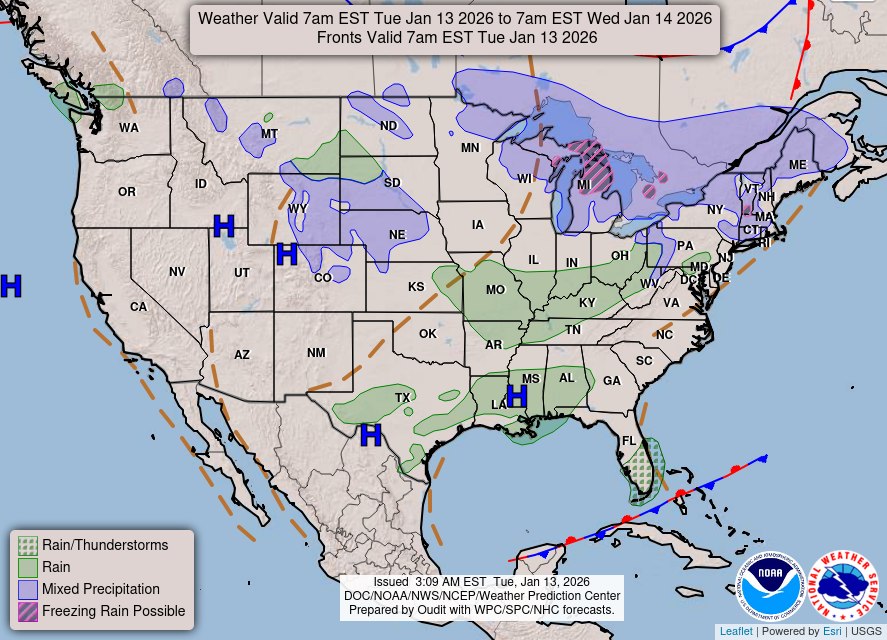
National Forecast Chart
High Resolution Version | Previous Days Weather Maps
Animated Forecast Maps | Alaska Maps | Pacific Islands Map
Ocean Maps | Legend | About These Maps

National Temperature
Alaska | Hawaii | Guam | Puerto Rico/Virgin Islands
More from the National Digital Forecast Database
Short Range Forecasts
Short range forecast products depicting pressure patterns, circulation centers and fronts, and types and extent of precipitation.
Medium Range Forecasts
Medium range forecast products depicting pressure patterns and circulation centers and fronts

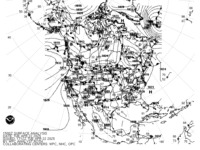
Surface Analysis
Highs, lows, fronts, troughs, outflow boundaries, squall lines, drylines for much of North America, the Western Atlantic and Eastern Pacific oceans, and the Gulf of Mexico.
Standard Size | High Resolution
Temperature
WPC Probabilistic Winter Precipitation Guidance
Maximum daytime or minimum overnight temperature in degrees Fahrenheit.
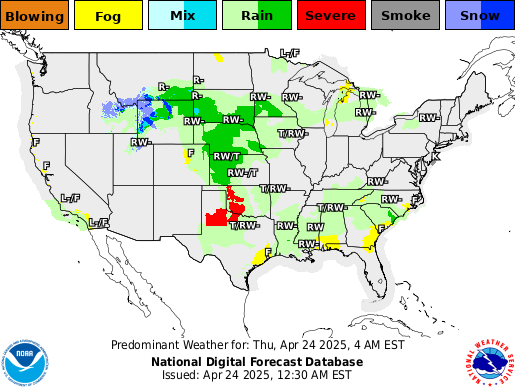
Predominant Weather
Expected weather (precipitating or non-precipitating) valid at the indicated hour. The weather element includes type, probability, and intensity information.
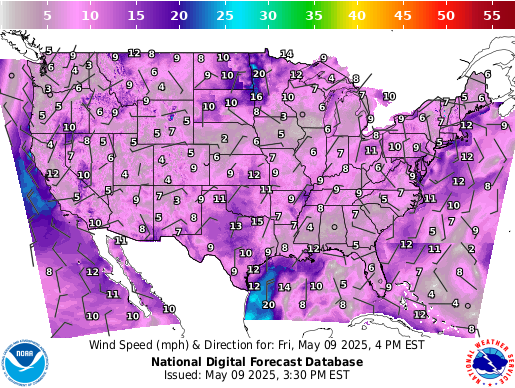
Wind Speed and Direction
Sustained wind speed (in knots) and expected wind direction (using 36 points of a compass) forecasts.
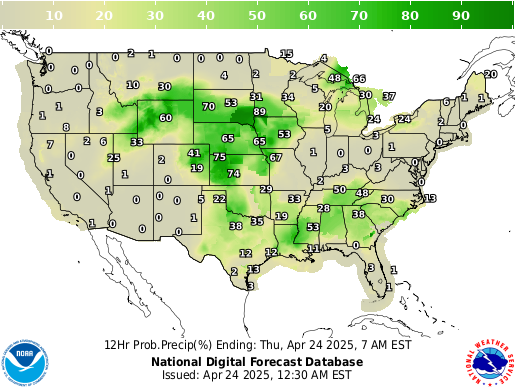
Chance of Precipitation
Likelihood, expressed as a percent, of a measurable precipitation event (1/100th of an inch).
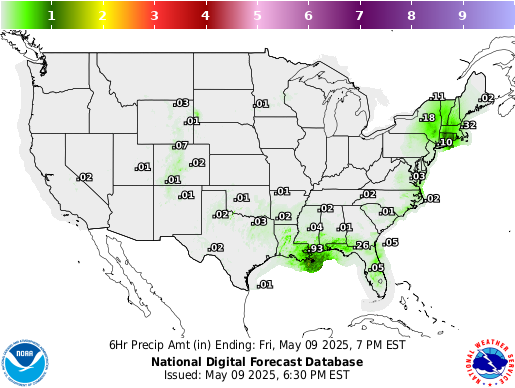
Precipitation Amount
Total amount of expected liquid precipitation.
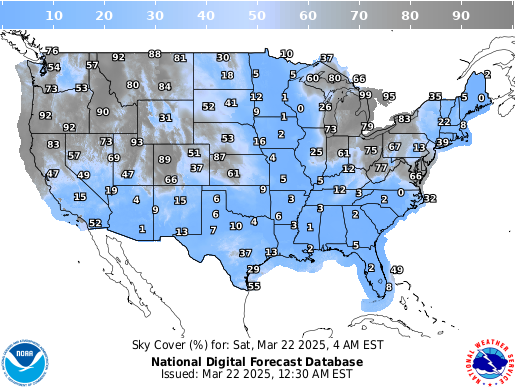
Sky Cover
Expected amount of opaque clouds (in percent) covering the sky.
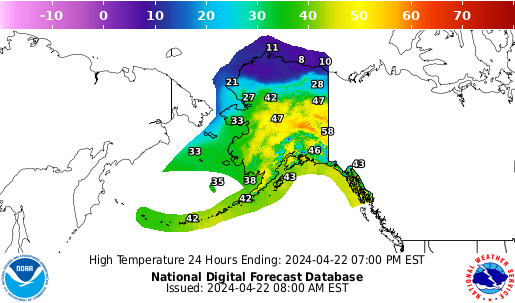
Alaska Graphical Forecasts
Graphical forecasts from the National Digital Forecast Database for Alaska.
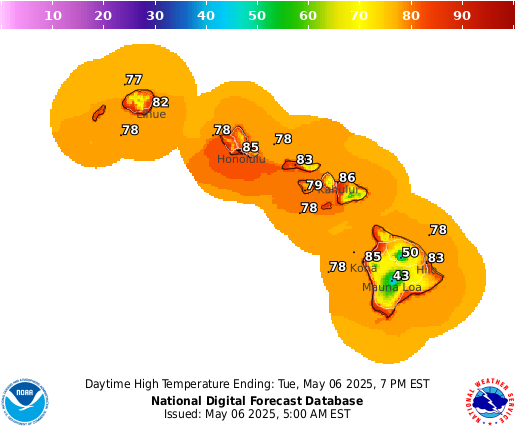
Hawaii Graphical Forecasts
Graphical forecasts from the National Digital Forecast Database for Hawaii.
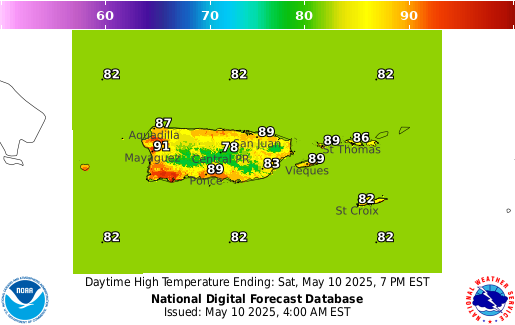
Puerto Rico Graphical Forecasts
Graphical forecasts from the National Digital Forecast Database for Puerto Rico and Virgin Islands.