
Like me on Facebook:
Sharonville, OH & US Weather
Follow me on X:

WWebmaster: Dr. Michael Moyer, Ph.D. can be reached at This email address is being protected from spambots. You need JavaScript enabled to view it. 


Powered by: Our Proud Sponsors!mik
 |
 |
 |
  |
  |
|


|
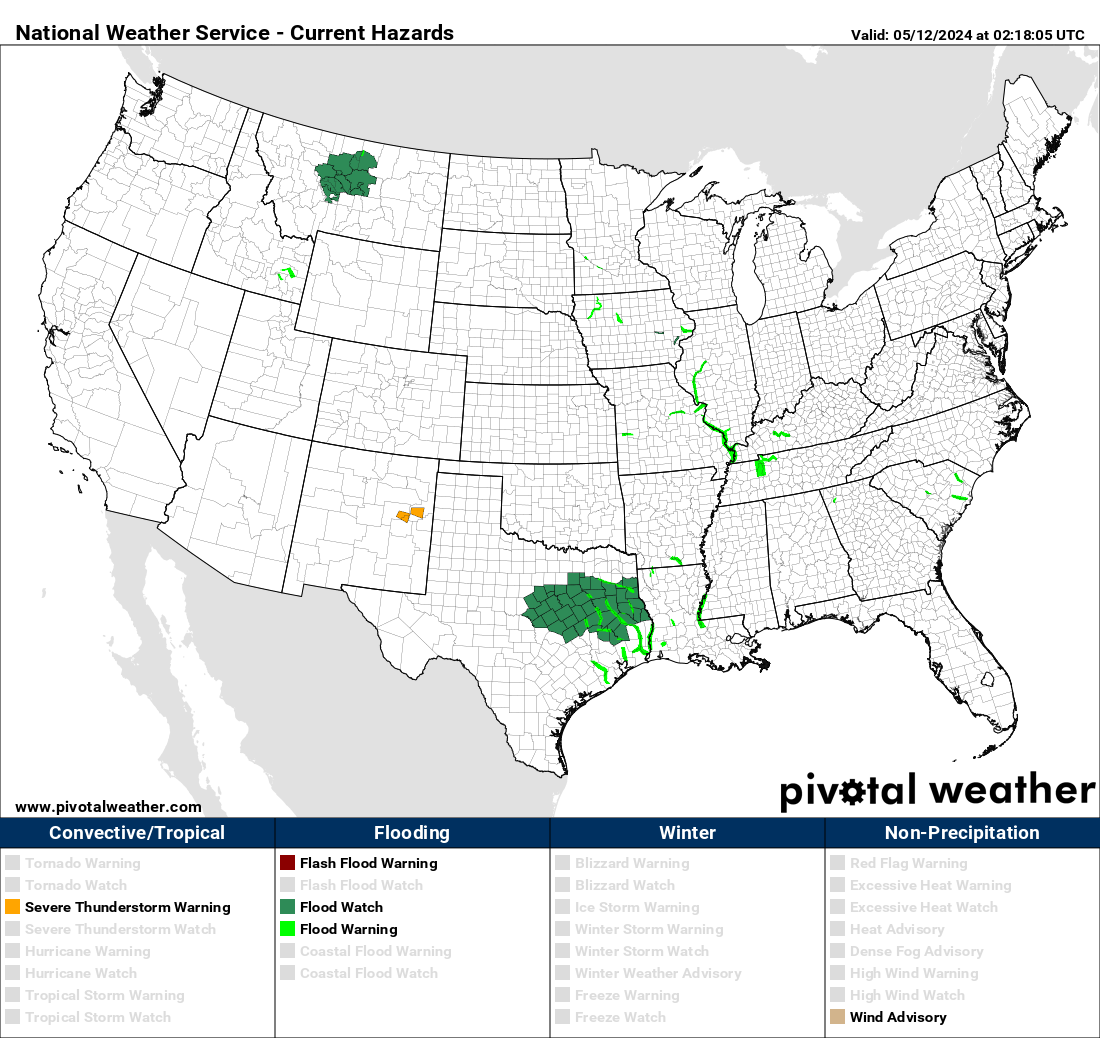
Your Local NWS Alerts Map: Click map then your area.
Quick 500mb level check temperatures
|
The Next 12 Days Forecast:
Day 4-8 Storm Outlook:
|


|
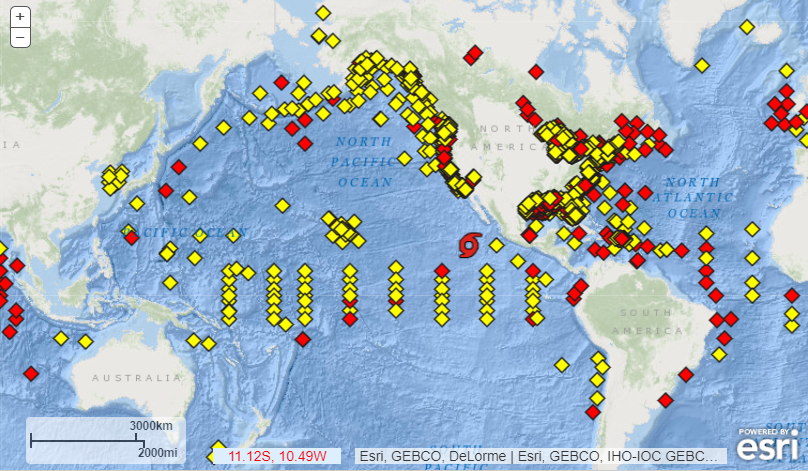
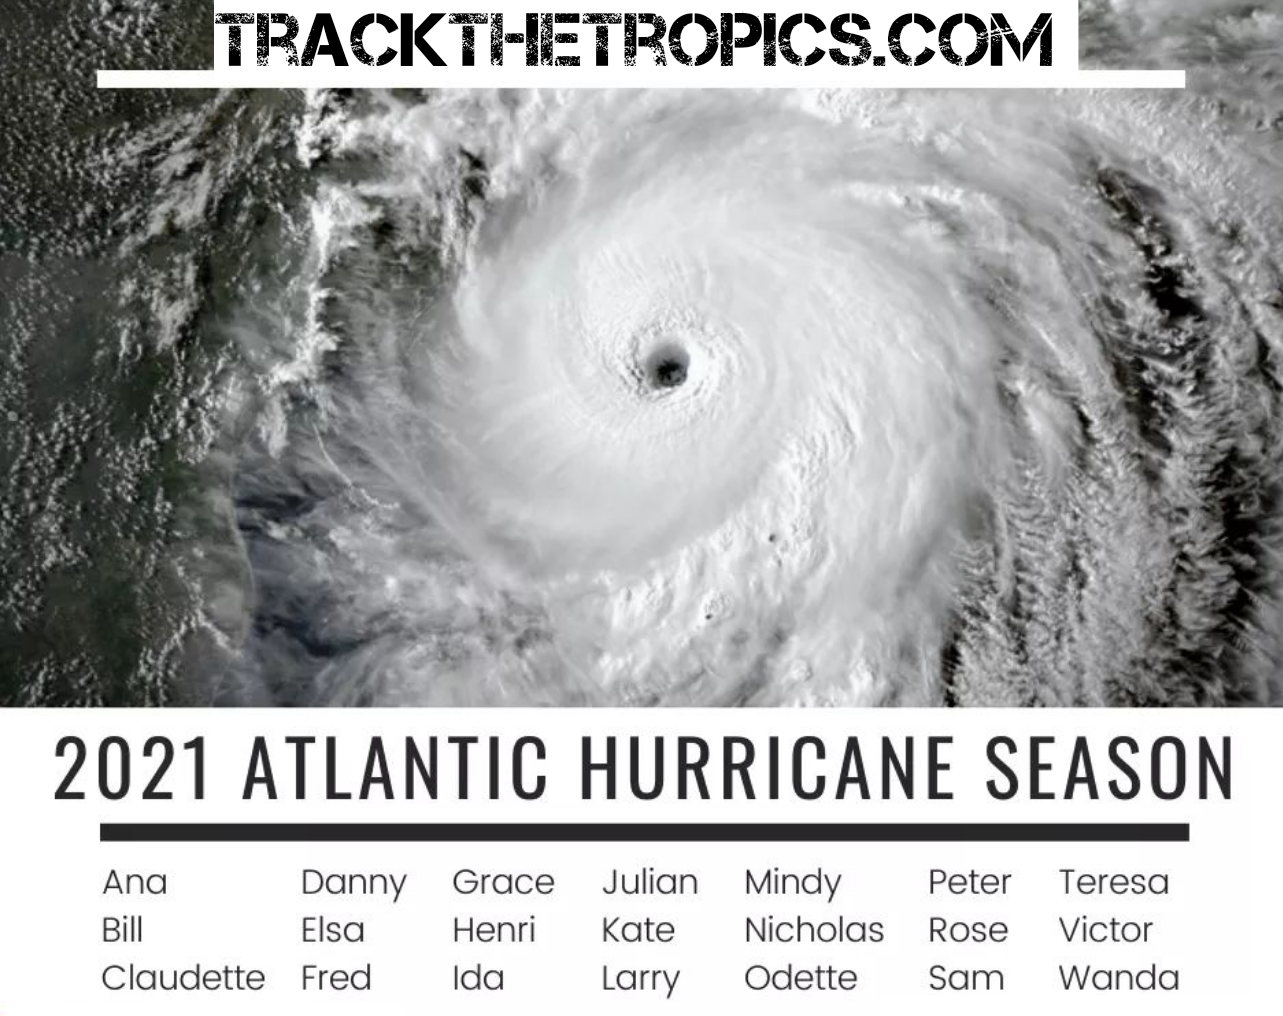
Track the Tropics!
|
||||||||||


|
|
|
Weather Station Data from Dr. Moyer's Wx station in Sharonville OH (Hamilton Co) |
Weather maps around the US: (Courtesy WeatherRoanoke).
 |
|
1SE Sharonville OH (Hamilton Co) (these are updated every 10 mins.) |
Who uses this Sharonville Data?
1) CWOP - Citizens Weather Observation Program ⇑ 
2) APRSWXNET - Automatic Position Reporting System as a WX NETwork.
3) Local NWS Office - KILN
4)  Community Collaborative Rain, Hail & Snow Network (CoCoRaHaHS)
5) Forecasting Model Data. = Finally, the more data that can be verified and sent to NOAA helps solidify the model and progress throughout the day strengthening of the entire model making it much more reliable of a forecast.
6) CWOP - Citizens Weather Observation Program Search Tool
8) Local News Media (TV, Radio & Electronic Media)
9) Reconstruction of accidents
**************************************************************************************************
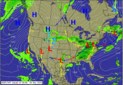
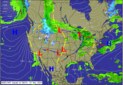
CONUS Radar
Quick Midwest Look

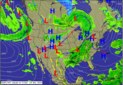
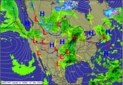
Initial Weather Situational Maps Awareness
|
|
Surface Maps | Jet stream; Satellite; Temps; Radar; 48hr Forecast |
 |
 |
 |
 |
|
 |
 |
 |
 |
 |
*****************************************************************************************
Hourly surface observations for the past 24 hours |
|||
| 00 UTC Low High |
06 UTC Low High |
12 UTC Low High |
18 UTC Low High |
| 01 UTC Low High |
07 UTC Low High |
13 UTC Low High |
19 UTC Low High |
| 02 UTC Low High |
08 UTC Low High |
14 UTC Low High |
20 UTC Low High |
| 03 UTC Low High |
09 UTC Low High |
15 UTC Low High |
21 UTC Low High |
| 04 UTC Low High |
10 UTC Low High |
16 UTC Low High |
22 UTC Low High |
| 05 UTC Low High |
11 UTC Low High |
17 UTC Low High |
23 UTC Low High |
(Unofficial) Record-breaking temperature across the Globe.
|
||||||

⇑ ⇑
Color Codes change, so to see the correct advisory, go to: WPC
https://www.weather.gov/iln/
|
SPECIAL WX STATEMENTS/WATCHES & WARNINGS-CLICK ON LINK
|
The Next Few Days Forecast:
WPC Interactive Page Day 1-3 / Day 3-7 / Animate Day 1-7
CSU / Albany / FSU / PSU / BurgWX / Polar
Cyclonicwx / DuPage / Fox / McNoldy
Weather / Tropical Tidbits / Weathernerds
Maps:
WPC Interactive Page Day 1-3 / Day 3-7 / Animate Day 1-7
Weather Viewer: Situational Awareness (Click on link)

(Cincinnati to the far right of your screen)
Weather Map in motion Interactive National Radar
H500 Surf Dwpt/Frontal Positions
 |
 |
|
|
|
|
 |


7-days in 7 seconds
Interactive Radar: (Make your own)


Satellite
Infrared Ohio Valley Satellite


- Global & Hemispheric Products
- Global Infrared Satellite Composite (Courtesy of SSEC)
- National Products
- US Infrared Satellite Image (Courtesy of SSEC)
- US Visible Satellite Image (Courtesy of SSEC)
- US Water Vapor Satellite Image (Courtesy of SSEC)
30-Day Temperature Outlook

90-Day Temperature Outlook

30-Day Precipitation Outlook

90-Day Precipitation Outlook
River Observations & Forecasts
Maps Superimposed on GOES Imagery
NH Surface Temperatures (5° increments)
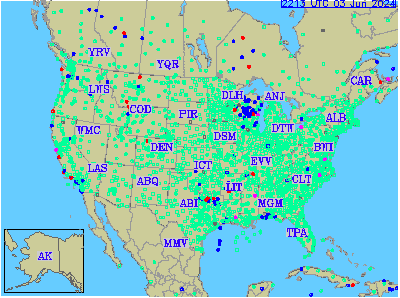
Sounding and Meteogram Data across the US
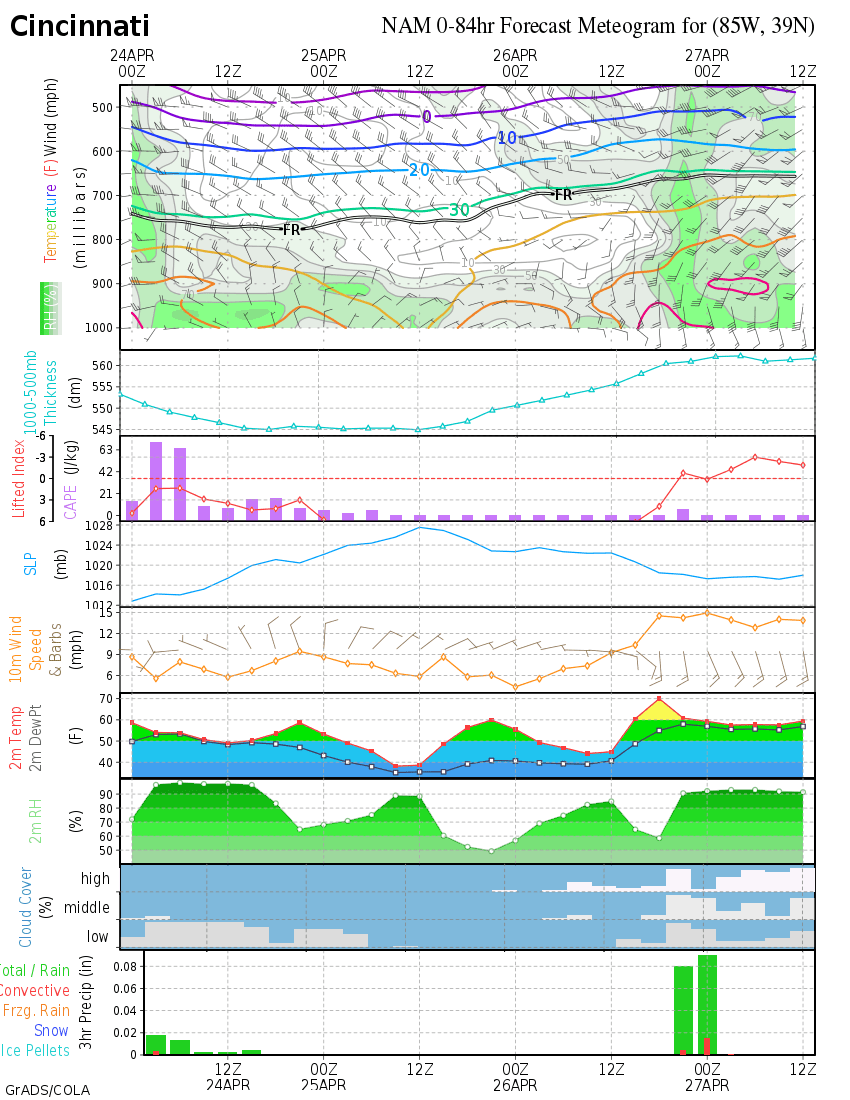
| Meteogram Generator (CVG) |
 |
Aviation Briefing (not for flight planning) |
 |
|
US satellite: Click on OH, IN, KY to show motion. Click on US satellite to go to the full US motion page.
************************************************************************************
| Get Your SKEW-T / #2 Skew-T / #3 Skew-T / #4 Skew-T Meteogram Generator (CVG) (CVG) |
Upper Air Maps - current, unanalyzed, and archived maps from SPC
Upper Air Data - upper air maps, soundings, and wind profiler information from NCAR
Soundings - upper air soundings from across the United States from SPC
SPC Mesoanalysis - real-time objectively analyzed maps from SPC, with a focus on severe weather parameters
Composite Map - interactive map where you can overlay several different weather maps
NWS Weather Prediction Center - Mesoscale Precipitation Discussions
ZSE Model VWP
Cloud And Precip 3-Day Forecast
(NAM 3-Hrly) CLICK IMAGE

Temperature 3-Day Forecast
(NAM 3-Hrly) CLICK IMAGE

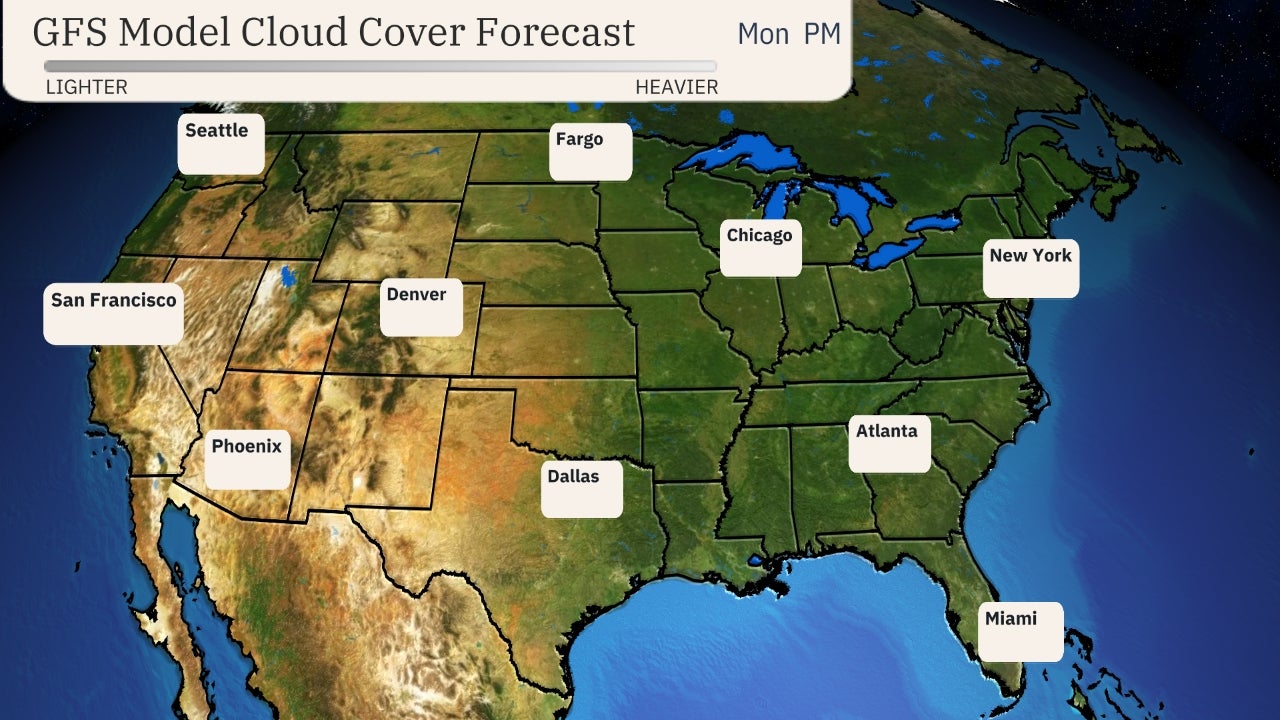
Cloud And Precip 10-Day Forecast
(GFS 6-Hrly) CLICK IMAGE

Jet Stream 10-Day Forecast
(GFS 6-Hrly) CLICK IMAGE

 |
Live Model Data:
|

 |
 |
 |
 |
 |
|
Interactive Forecast Maps (Ventusky.com) |
Western North Atlantic - 3 Days (NAM) |
|
|
Regional (station means, histories, etc) Historical climate indices: |
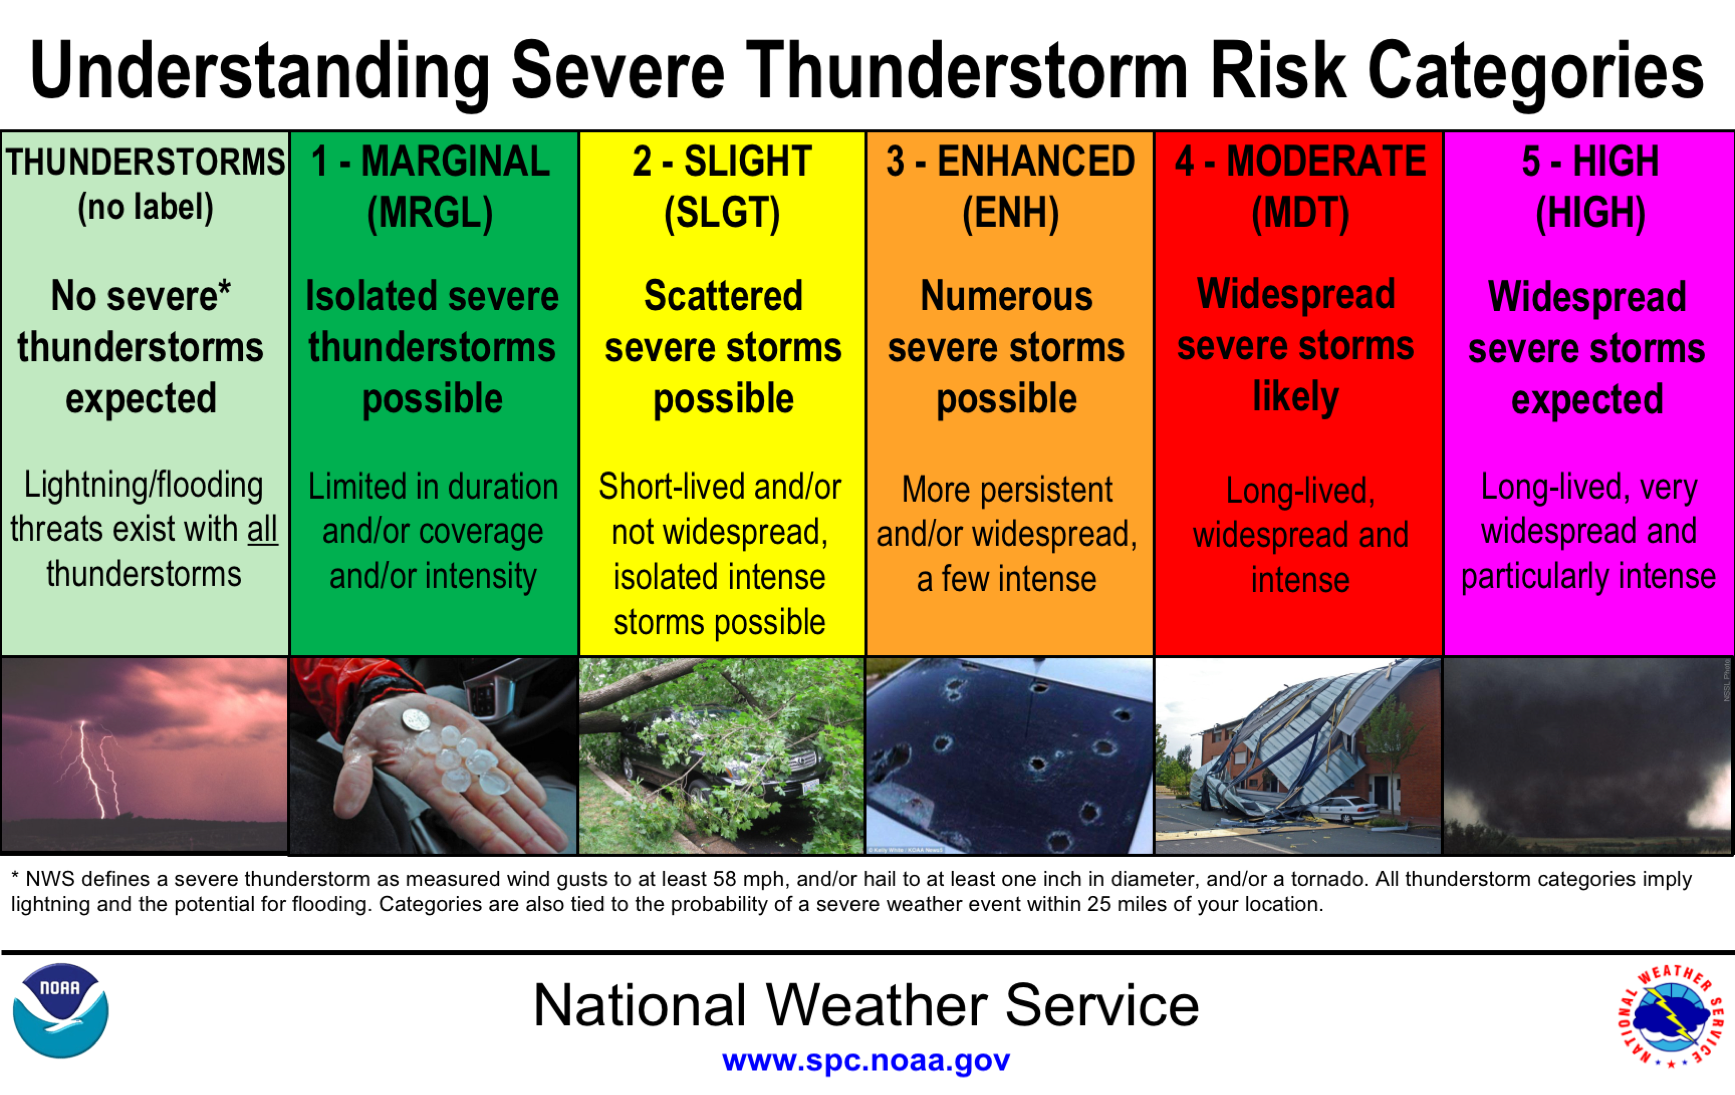
General (Overall), severe thunderstorms, tornadoes, hail, etc overview.
| |
| Hourly Surface Data for the Continental U.S. View the National Weather Service Unified Surface Analysis |
| WPC's Surface Analysis Archive Surface analyses in jpeg format |
| Severe Weather Parameters (KCVG) | Model Weather Parameters (KCVG) |
HRRR Text Extraction
|
Model Meteograms:
|
|
North America / Without Surface Observations
|
![[current sfc analysis]](https://www.wpc.ncep.noaa.gov/sfc/90fwbg_sm.jpg)
Upper Air: 925mb, 850mb, 700mb, 500mb, 250mb, SPC analyses, SPC Soundings, 5-day NH loop
| SOURCE | MB HEIGHT | |||||||
|---|---|---|---|---|---|---|---|---|
| PSU | ---- | H85 | H7 | H5 | H3 | ----- | ---- | ------- |
| NCAR | ---- | H85 | H7 | H5 | H3 | H25 | H2 | ------- |
| CMC | ---- | H85 | H7 | H5 | ---- | H25 | ---- | ------- |
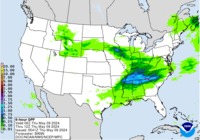
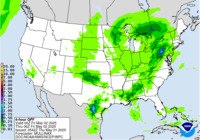
24 Hour Precipitation Total - Day 1
 Day 1 QPF [contours only] |
![]()
6 Hourly Precipitation Amounts - Day 1
 Update (00-06 hr) Update (00-06 hr)[contours only] |
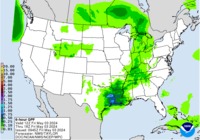 06-12 hr. 06-12 hr.[contours only] |
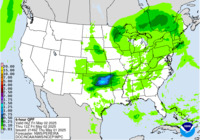 12-18 hr. 12-18 hr.[contours only] |
 18-24 hr. [contours only] |
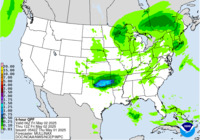 24-30 hr. [contours only] |
National Weather Service River Forecast Centers

From the Storm Prediction Center (SPC):
 |
 |
 |
| Mesoscale Discussion | MD |
| IEM V-Tec App | VTec App |
| Lightning Maps.org | LMaps |
| SPC Mesoscale Analysis | SPC MA |
| Current Surface Features | Surface |
| Wundermap | WUM |
| GOES Imagery Viewer | GOES Satellite |
Cooperative Institute for Precipitation Systems (CIPS) Map DATA
| Day 1 (F024) | Day 2 (F048) | Day 3 (F072) | Day 4 (F096) | Day 5 (F120) | Day 6 (F144) | Day 7 (F168) | Day 8 (F192) |
 |
 |
 Current U.S. SPC Activity Chart |
 Latest U.S. Mesoscale Discussion |
 Current U.S. Mesoscale Discussions |
U.S. Convective Watches |
Todays U.S. Severe Storm Report |
 U.S. Year to Date Severe Weather Report |
UK Agricultural Weather Center
-CIPS Experimental Analog-Based Severe Probability Guidance
Around the United States: Lightning Maps
Weather Camera's (Check times; some camera's are down)
https://www.wcpo.com/traffic/traffic-cams
Norwood › North: Downtown Cincinnati - Visitor Center

 Webcam Kings Mills, Ohio
  Webcam Milford, Ohio
Additional:  Webcam Lebanon, Ohio
  Webcam Kettering, Ohio
 Webcam Greensburg, Indiana
  Webcam Connersville, Indiana
  Webcam Indianapolis, Indiana
  Webcam Greenfield, Indiana
Tower Cam 1
Tower Cam 2


|

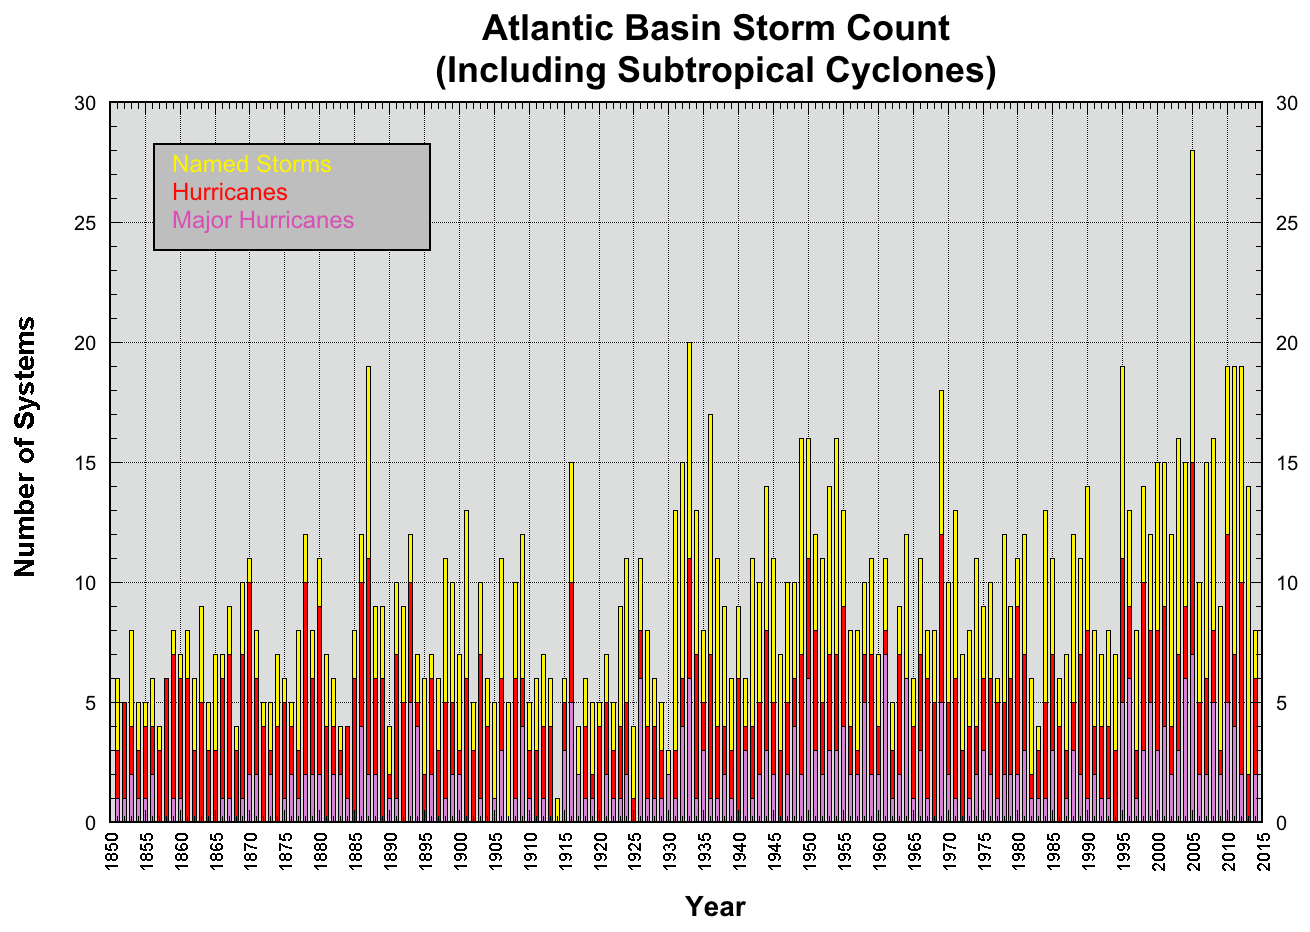
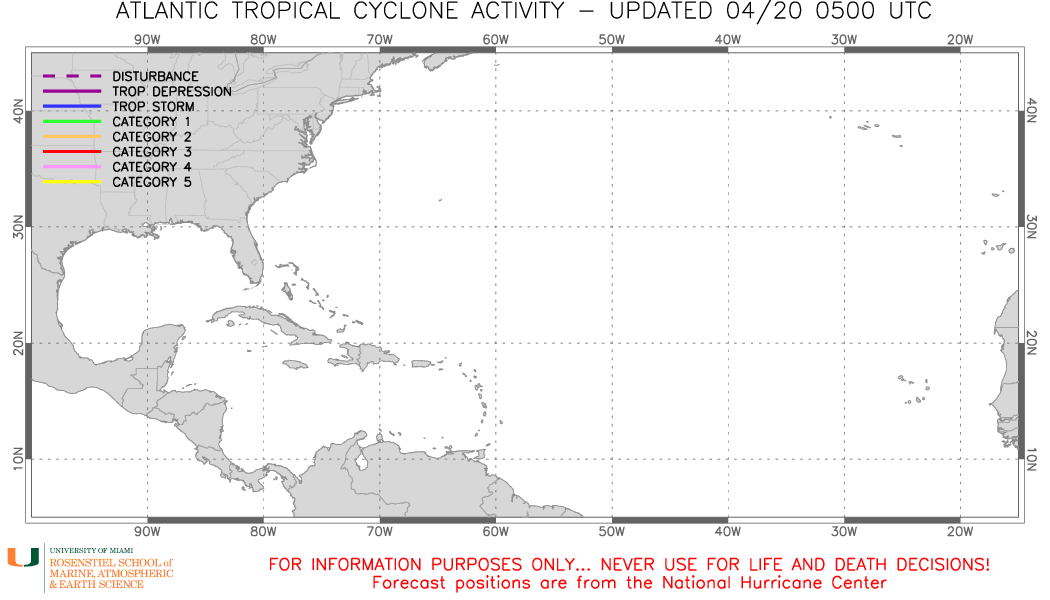
TROPICAL CYCLONE CLASSIFICATIONS
|
Tropical Depression (numbered)
|
20 - 34 knots |
|
Tropical Storm (named)
|
35 - 64 knots |
|
Hurricane (named)
|
65 knots or higher |
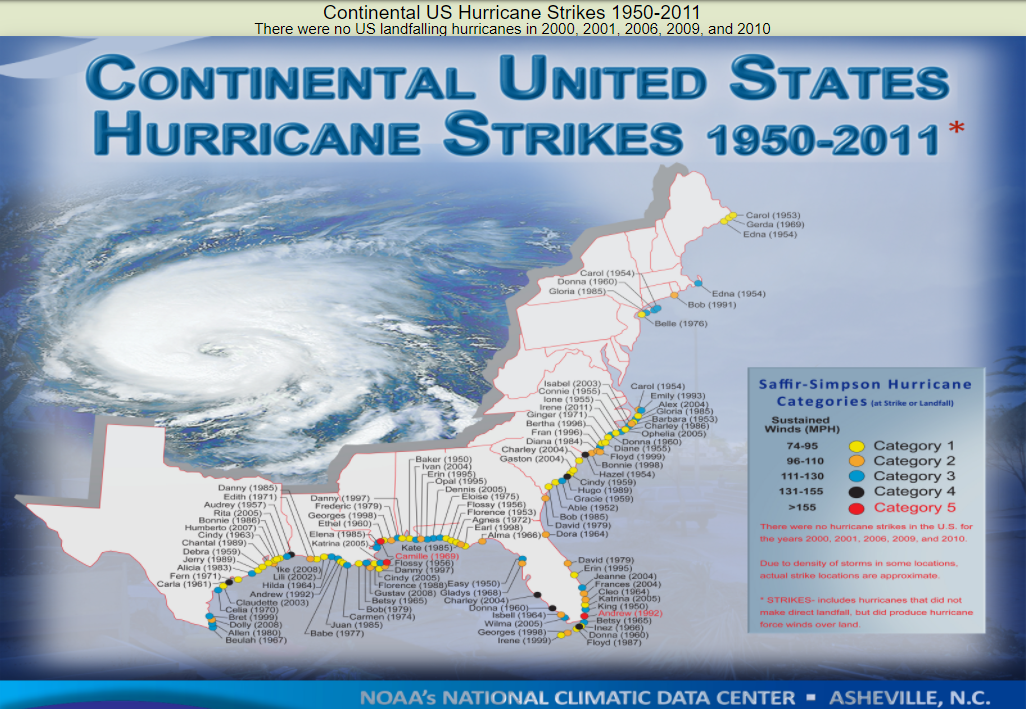
Saffir-Simpson Scale
| Category | Wind - KTS | Wind - MPH | Pressure - MB |
| 1 | 64 - 82 | 74 - 95 | > 980 |
| 2 | 83 - 95 | 96 - 110 | 965 - 979 |
| 3 | 96 - 112 | 111 - 129 | 945 - 964 |
| 4 | 113 - 136 | 130 - 156 | 920 - 944 |
| 5 | > 137 | > 157 | < 920 |
Tropical Cyclone Formation Probability Guidance Product
| Area Buoys latlon appr |
42059 15.0N 67.4W |
42085 17.8N 66.5W |
41053 18.5N 66.0W |
41043 21N 65W |
SRBV3 17.8N 64.7W |
41052 18.3N 64.7W |
42060 16.5N 63.5W |
BARA9 17.6N 61.8W |
41044 21.6N 58.7W |
TJUA radar status |
Graphical Forecast |

River Forecasts & Observations
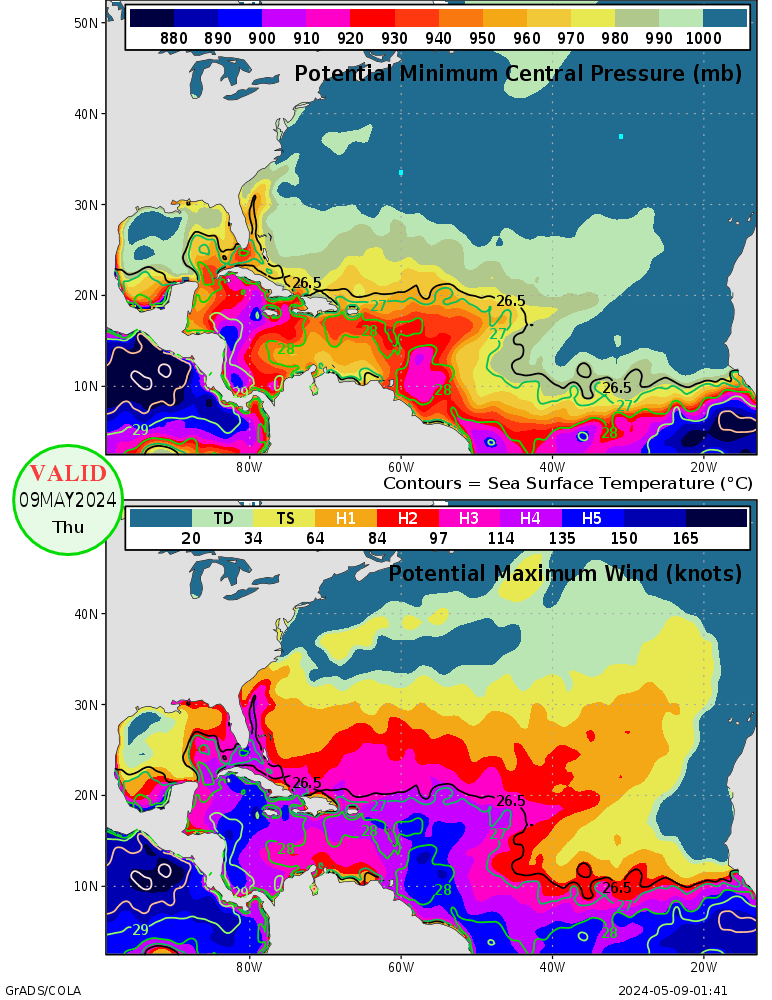
Baron Hurricane Index / Maximum Hurricane Intensity

NWS Forecasted Positions of Storm(s)
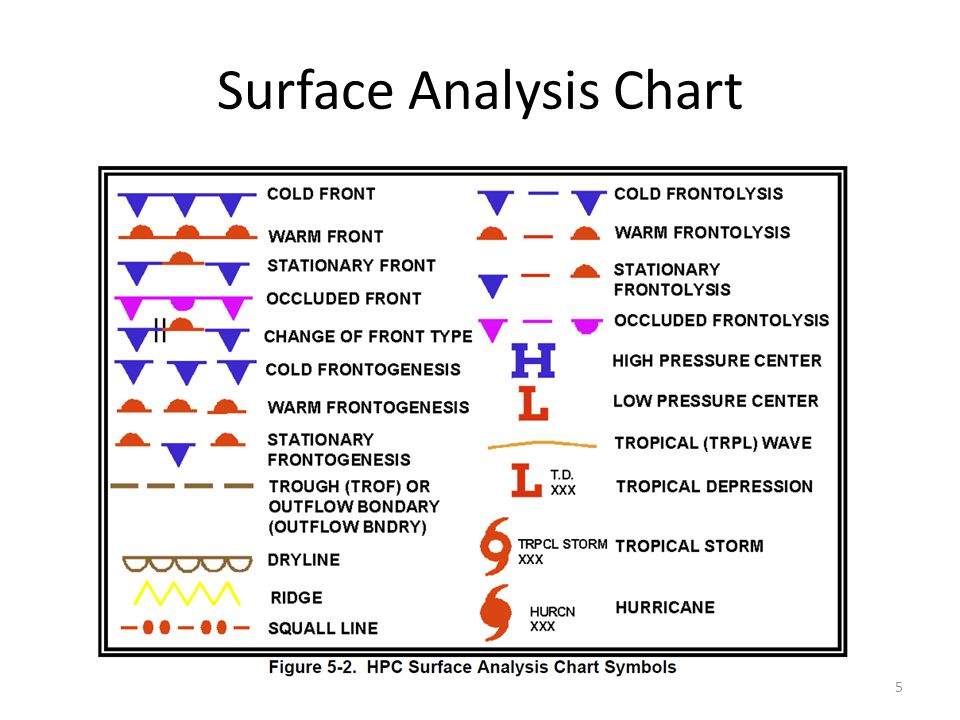
Surface Chart Symbols
48-Hour NHC Forecast Map:
72-Hour NHC Forecast Map: 
NHC Analysis Tools
Below are tools and data made available for the web.

| Atlantic | East Pacific | |
| Hovmöller Diagram (5 day Satellite) |
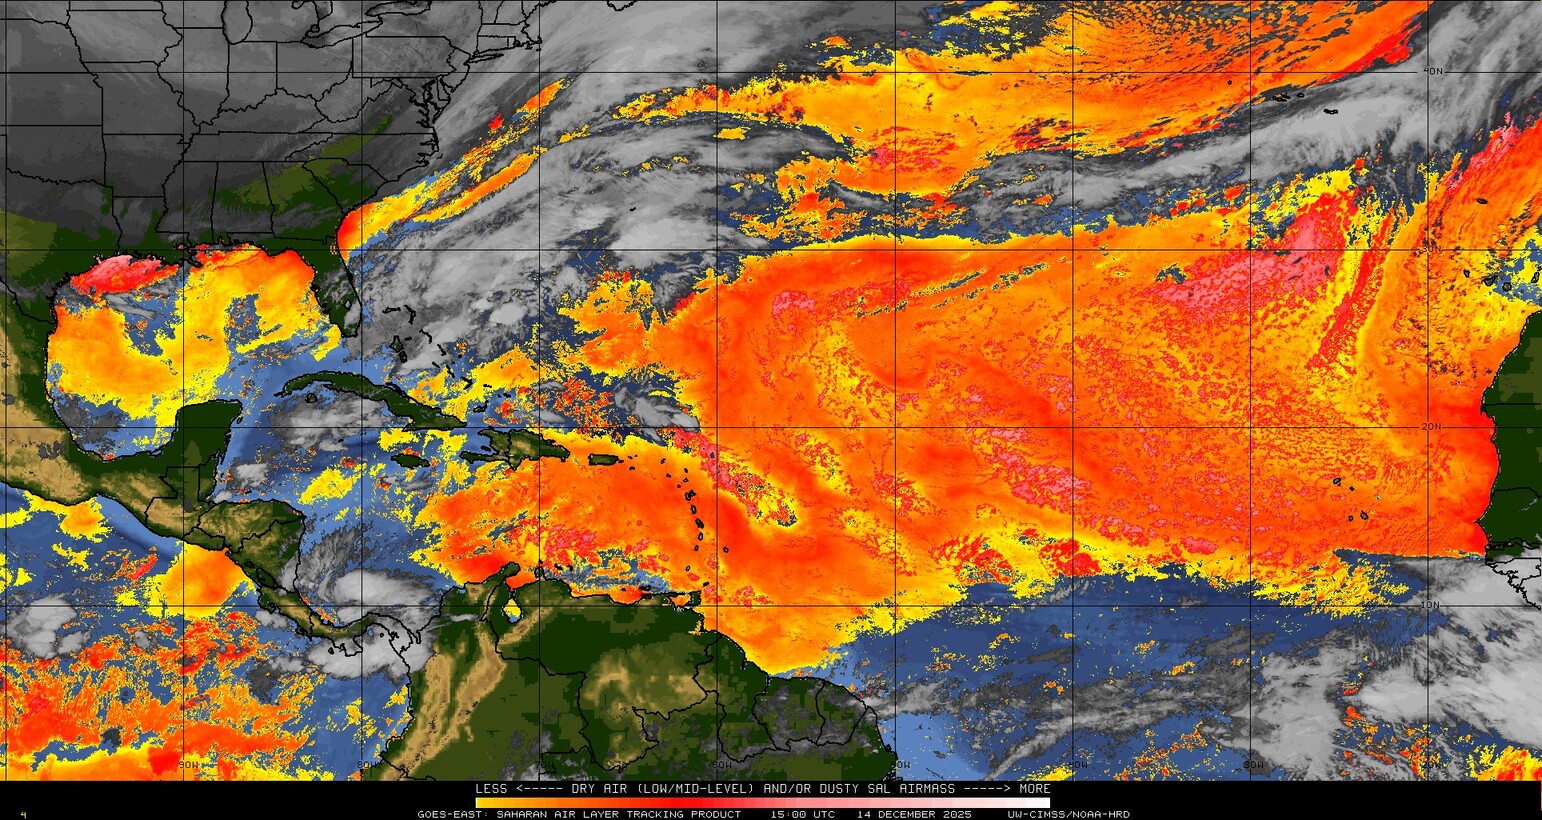
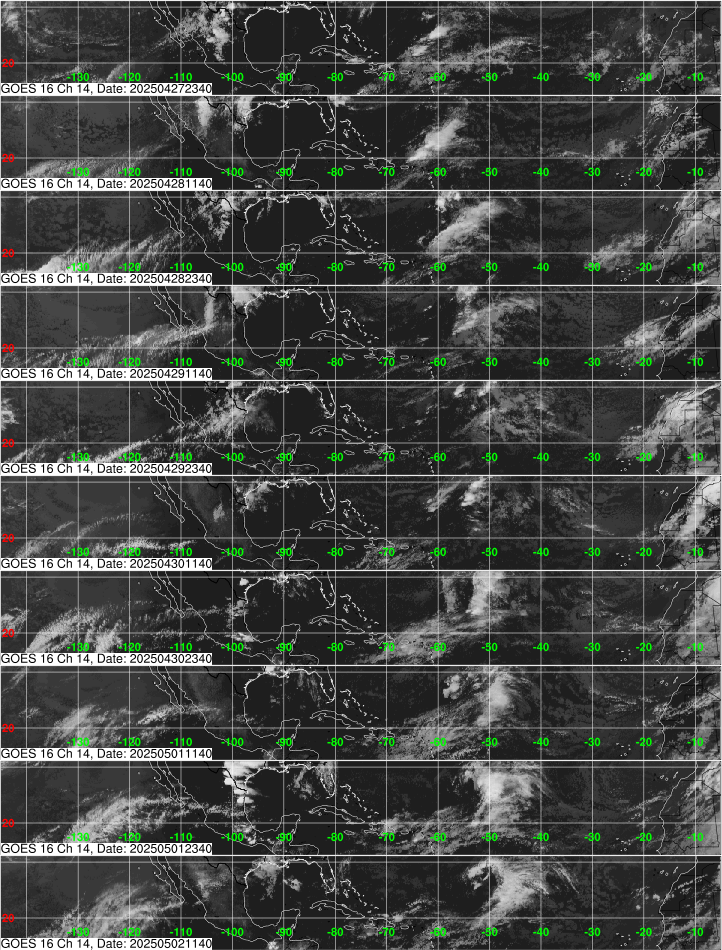
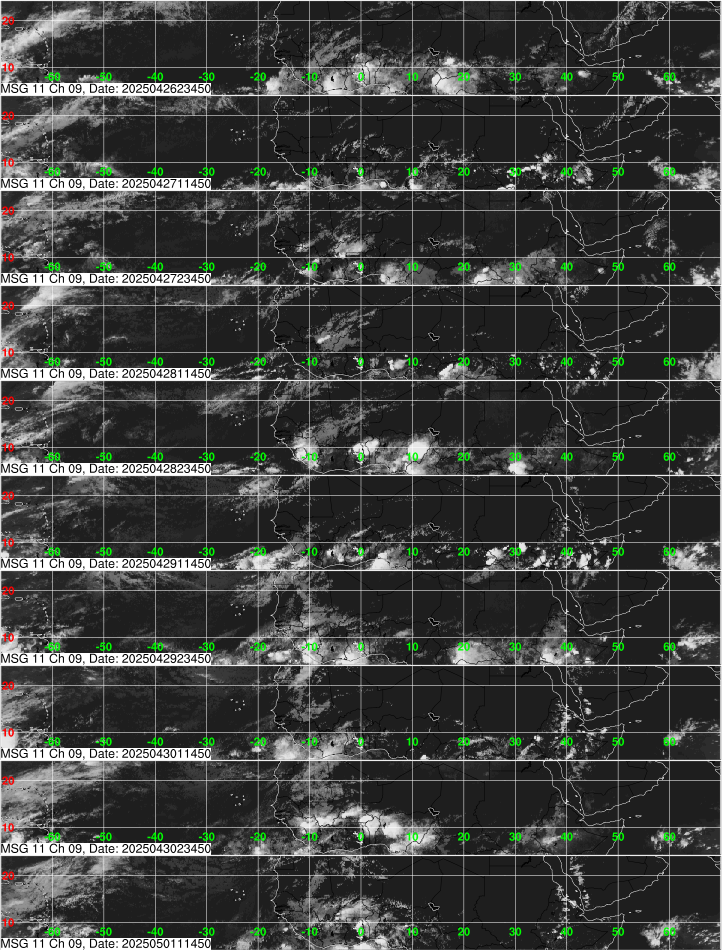
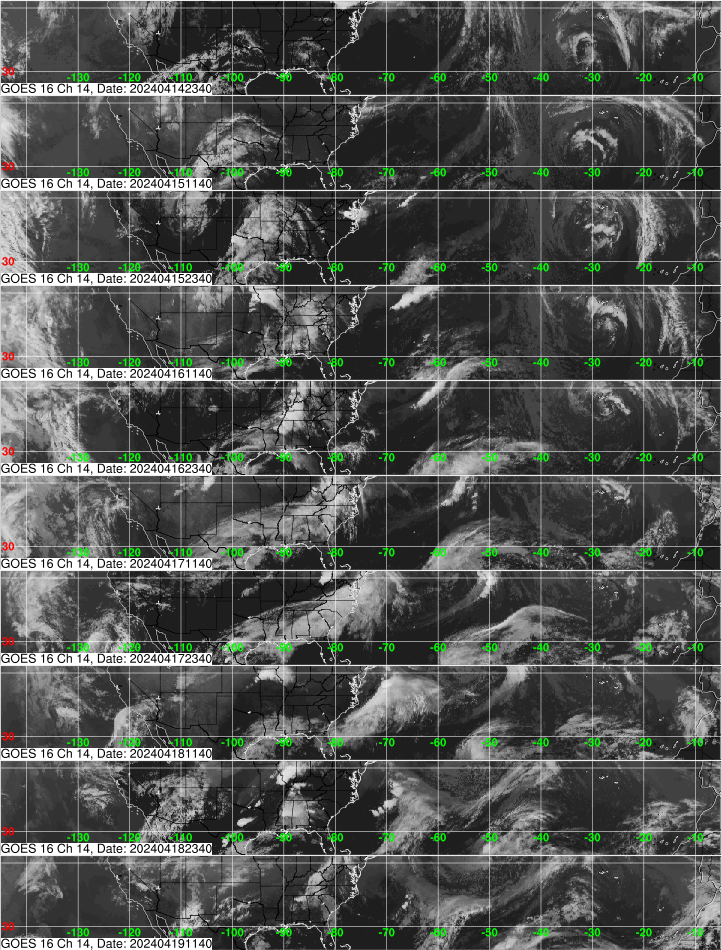
Tropical Atlantic and Caribbean (GOES-E) Gulf of Mexico and subtropical Atlantic Eastern Atlantic and Africa (METEOSAT-10) Southern CONUS and subtropical Atlantic (GOES-E) |
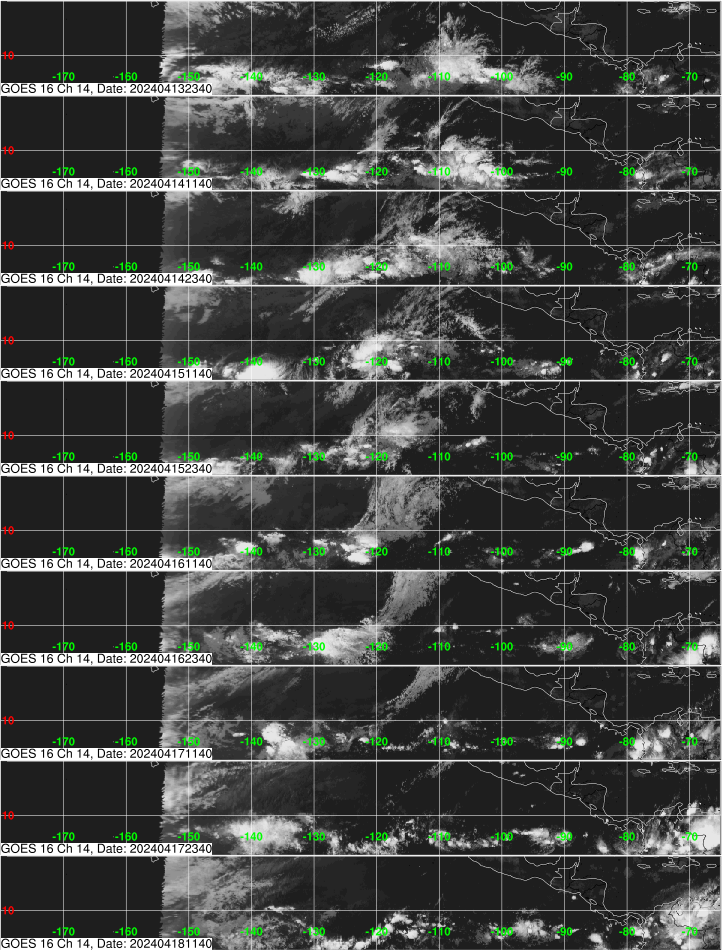
East Pacific (GOES-W) |
| Upper-Air Time Sections | Selected Observing Stations | |
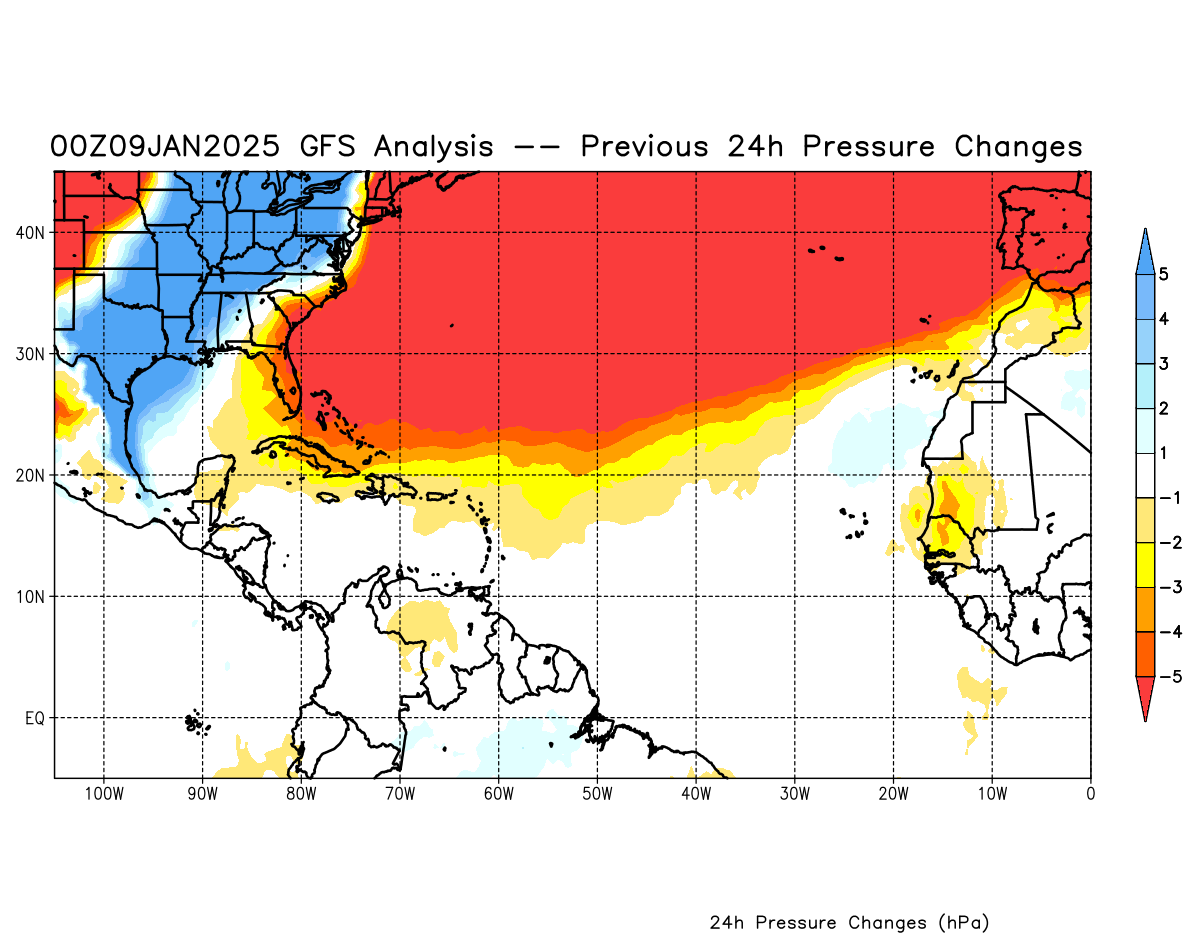
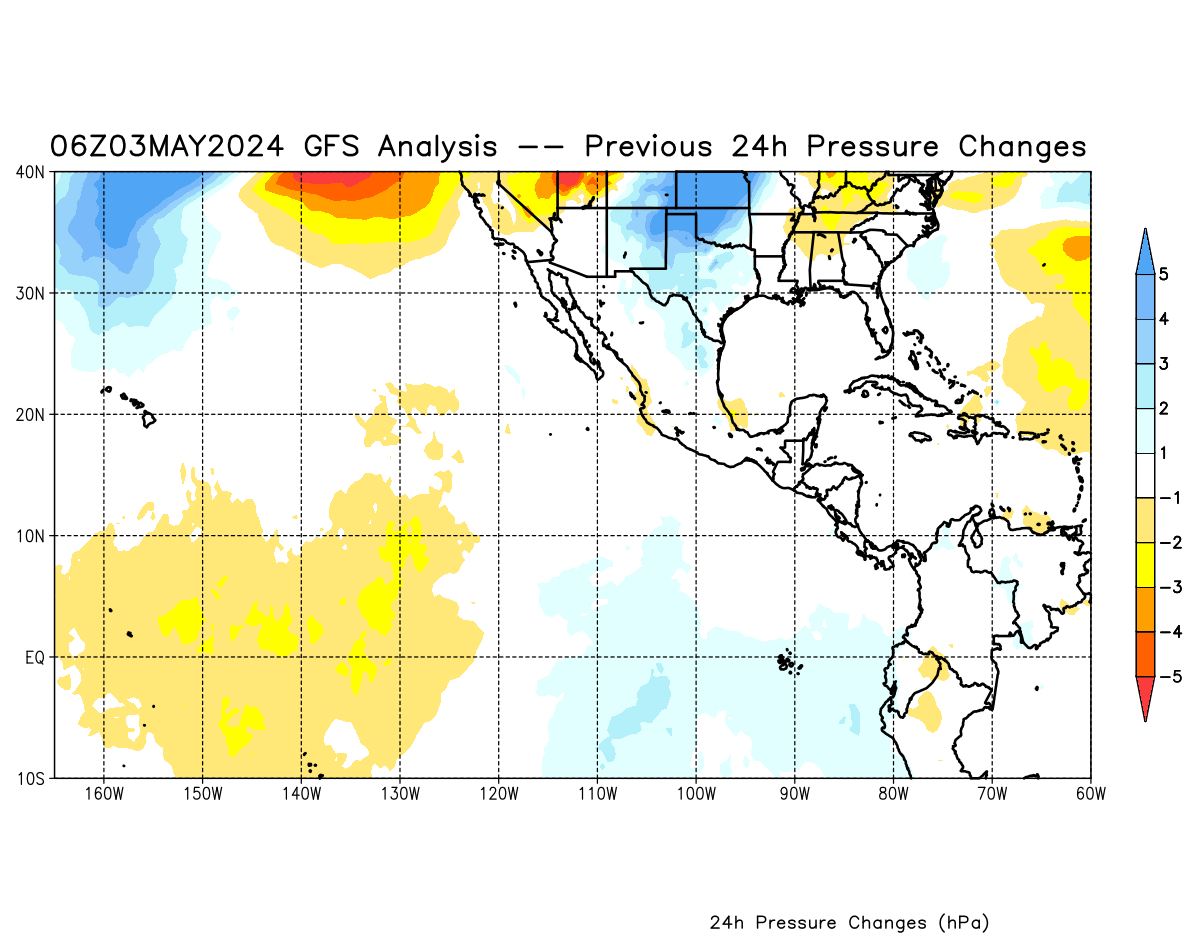
| GFS Pressure Change Analysis | See image | See image |
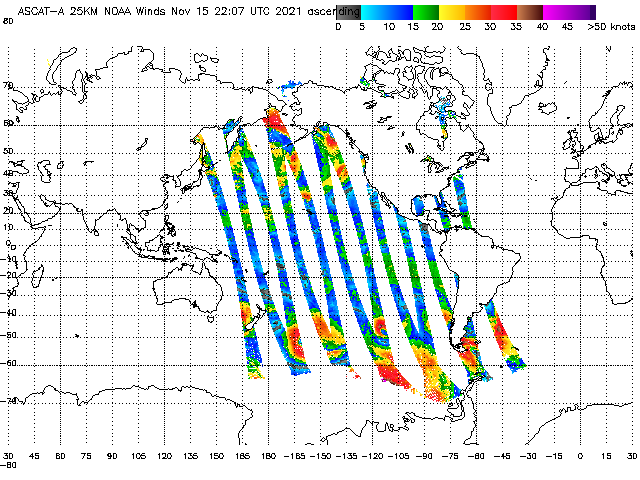
| ASCAT Ocean Wind Data | See recent data | |
| Streamlines | NCEP Model Analyses & Guidance | |
| Sea Surface Temperature | Analysis and Anomalies | |
| Tropical Rainfall | Experimental Text & Graphics | |
| NDBC Station List | National Buoys | |
| CyclonicWx (GFS) | CyclonicWx | |
| NOAA Ensembles | ENSEMBLES | |
| Aircraft recon | Recon decoded | |
| Aircraft recon (Fill in) | Manual decoder | |
One more website full of information = http://www.stormhamster.com/index.html
**This is not an official course, merely a speculation of what may occur with this storm. Tune into the National Hurricane Center or your local NWS office for official decisions.
https://spaghettimodels.com/ (Mike's Hurricane Page)
Tropics

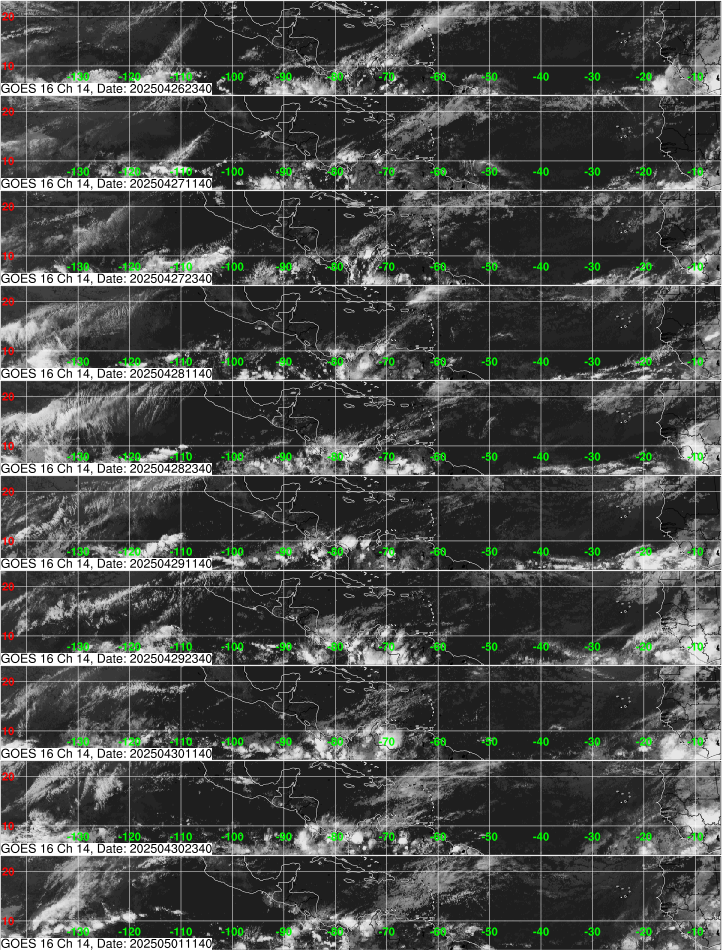
Satellite: US visible, US infrared, US water vapor, GOES-16 Experimental, MODIS browser
National Data Buoy Center
 |
|
Satellite View
Ocean Currents / National Buoy Center

Climate:

Weather Products


|


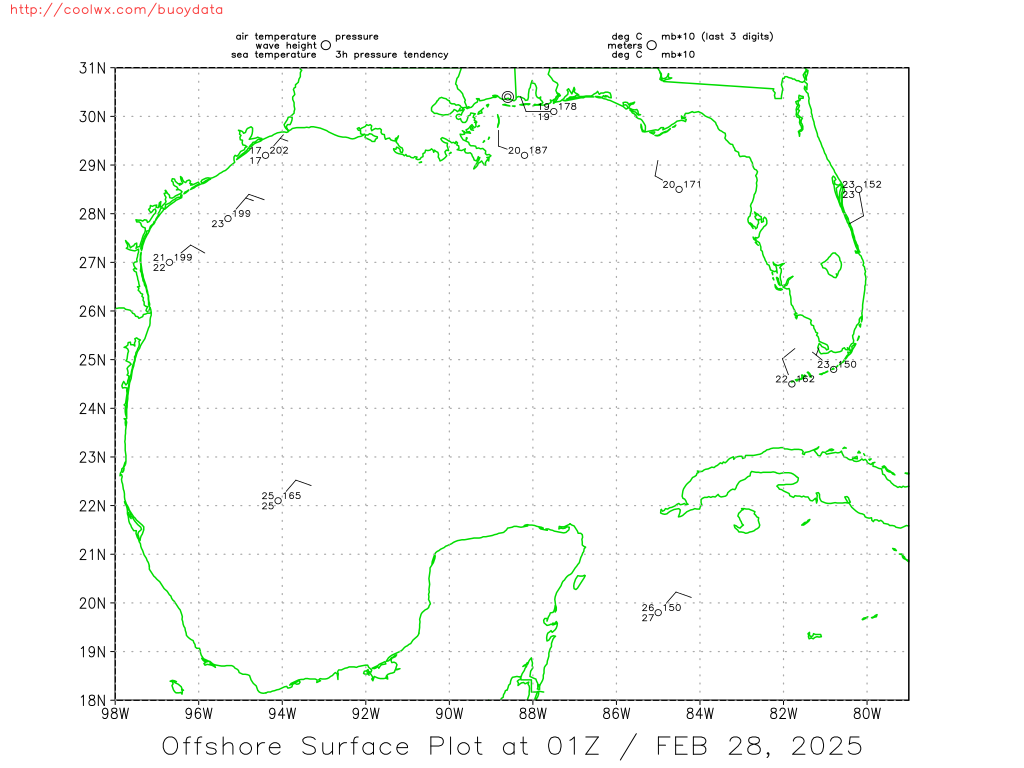
Current Look at Conditions:
Gulf Winds / Gulf Pressures / Caribbean / Puerto Rico
Current Look at Buoy Data:
Gulf of Mexico / Caribbean / SouthEast
NHC Marine Discussions and Custom Maps:
Gulf of Mexico / Caribbean / SW Atlantic
Webcams:
Florida Webcams / American Eagle Webcam
 5 Day Tropical Weather Outlook
International Meteorology Database
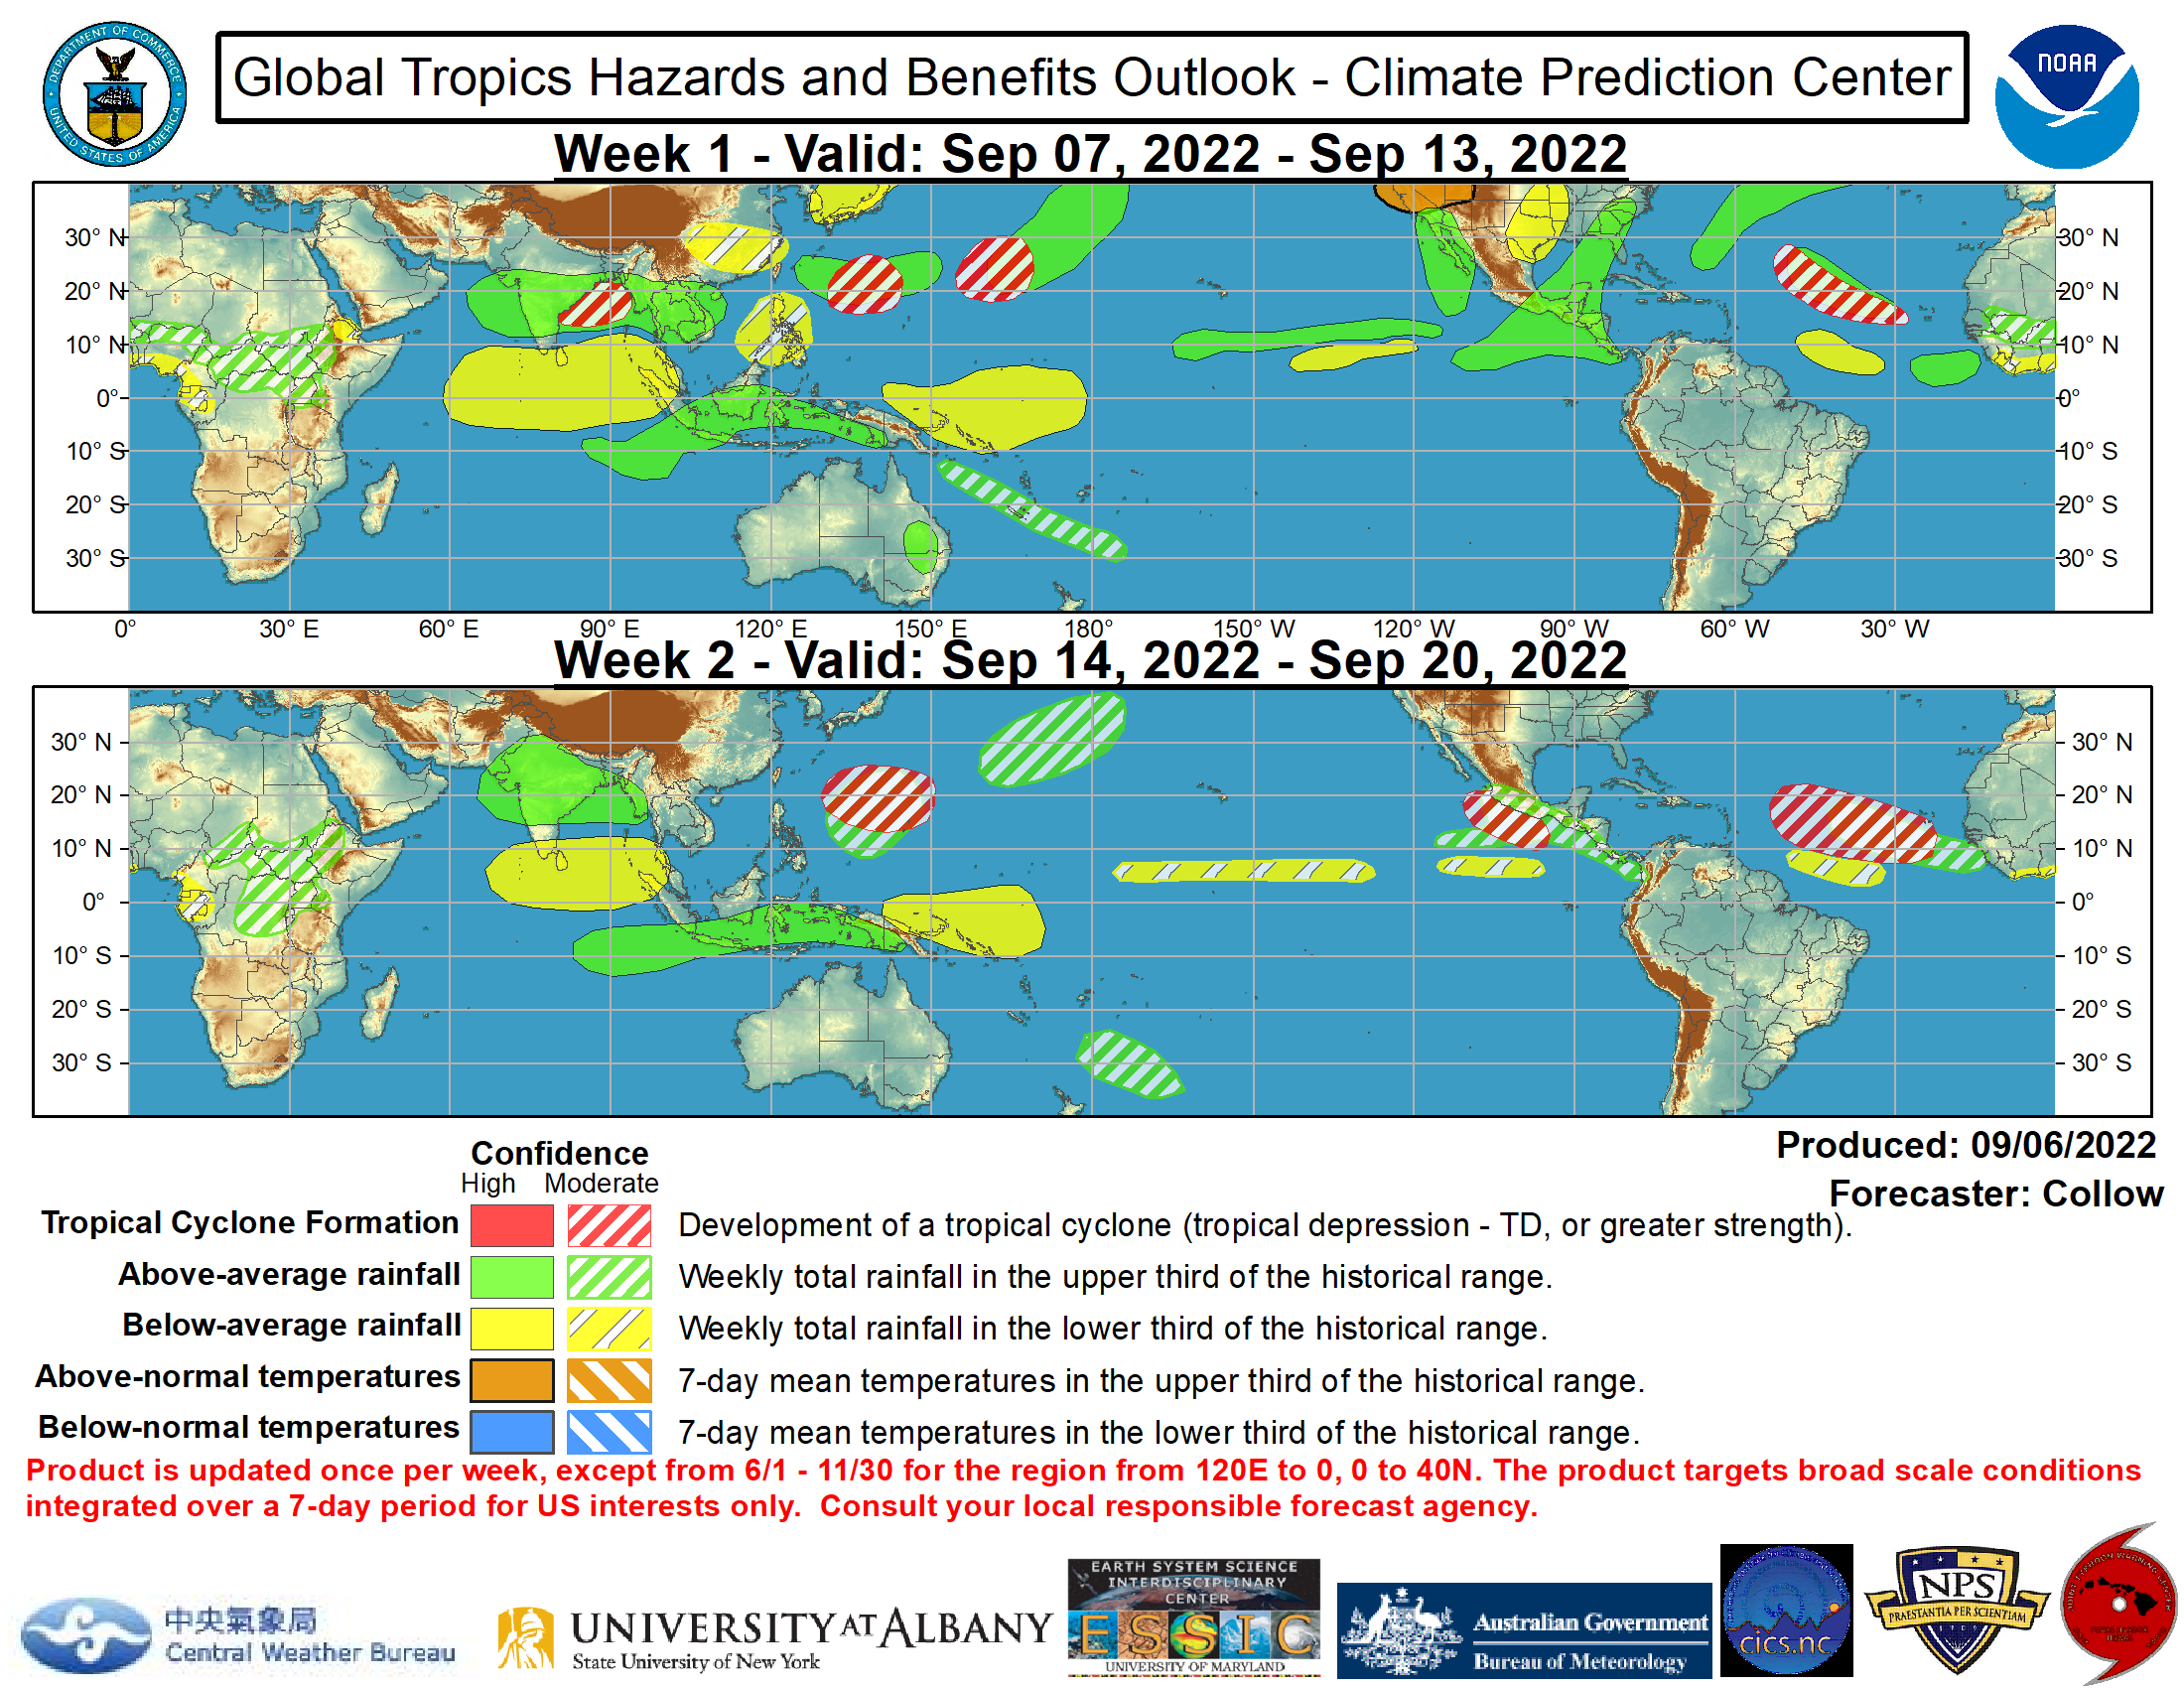
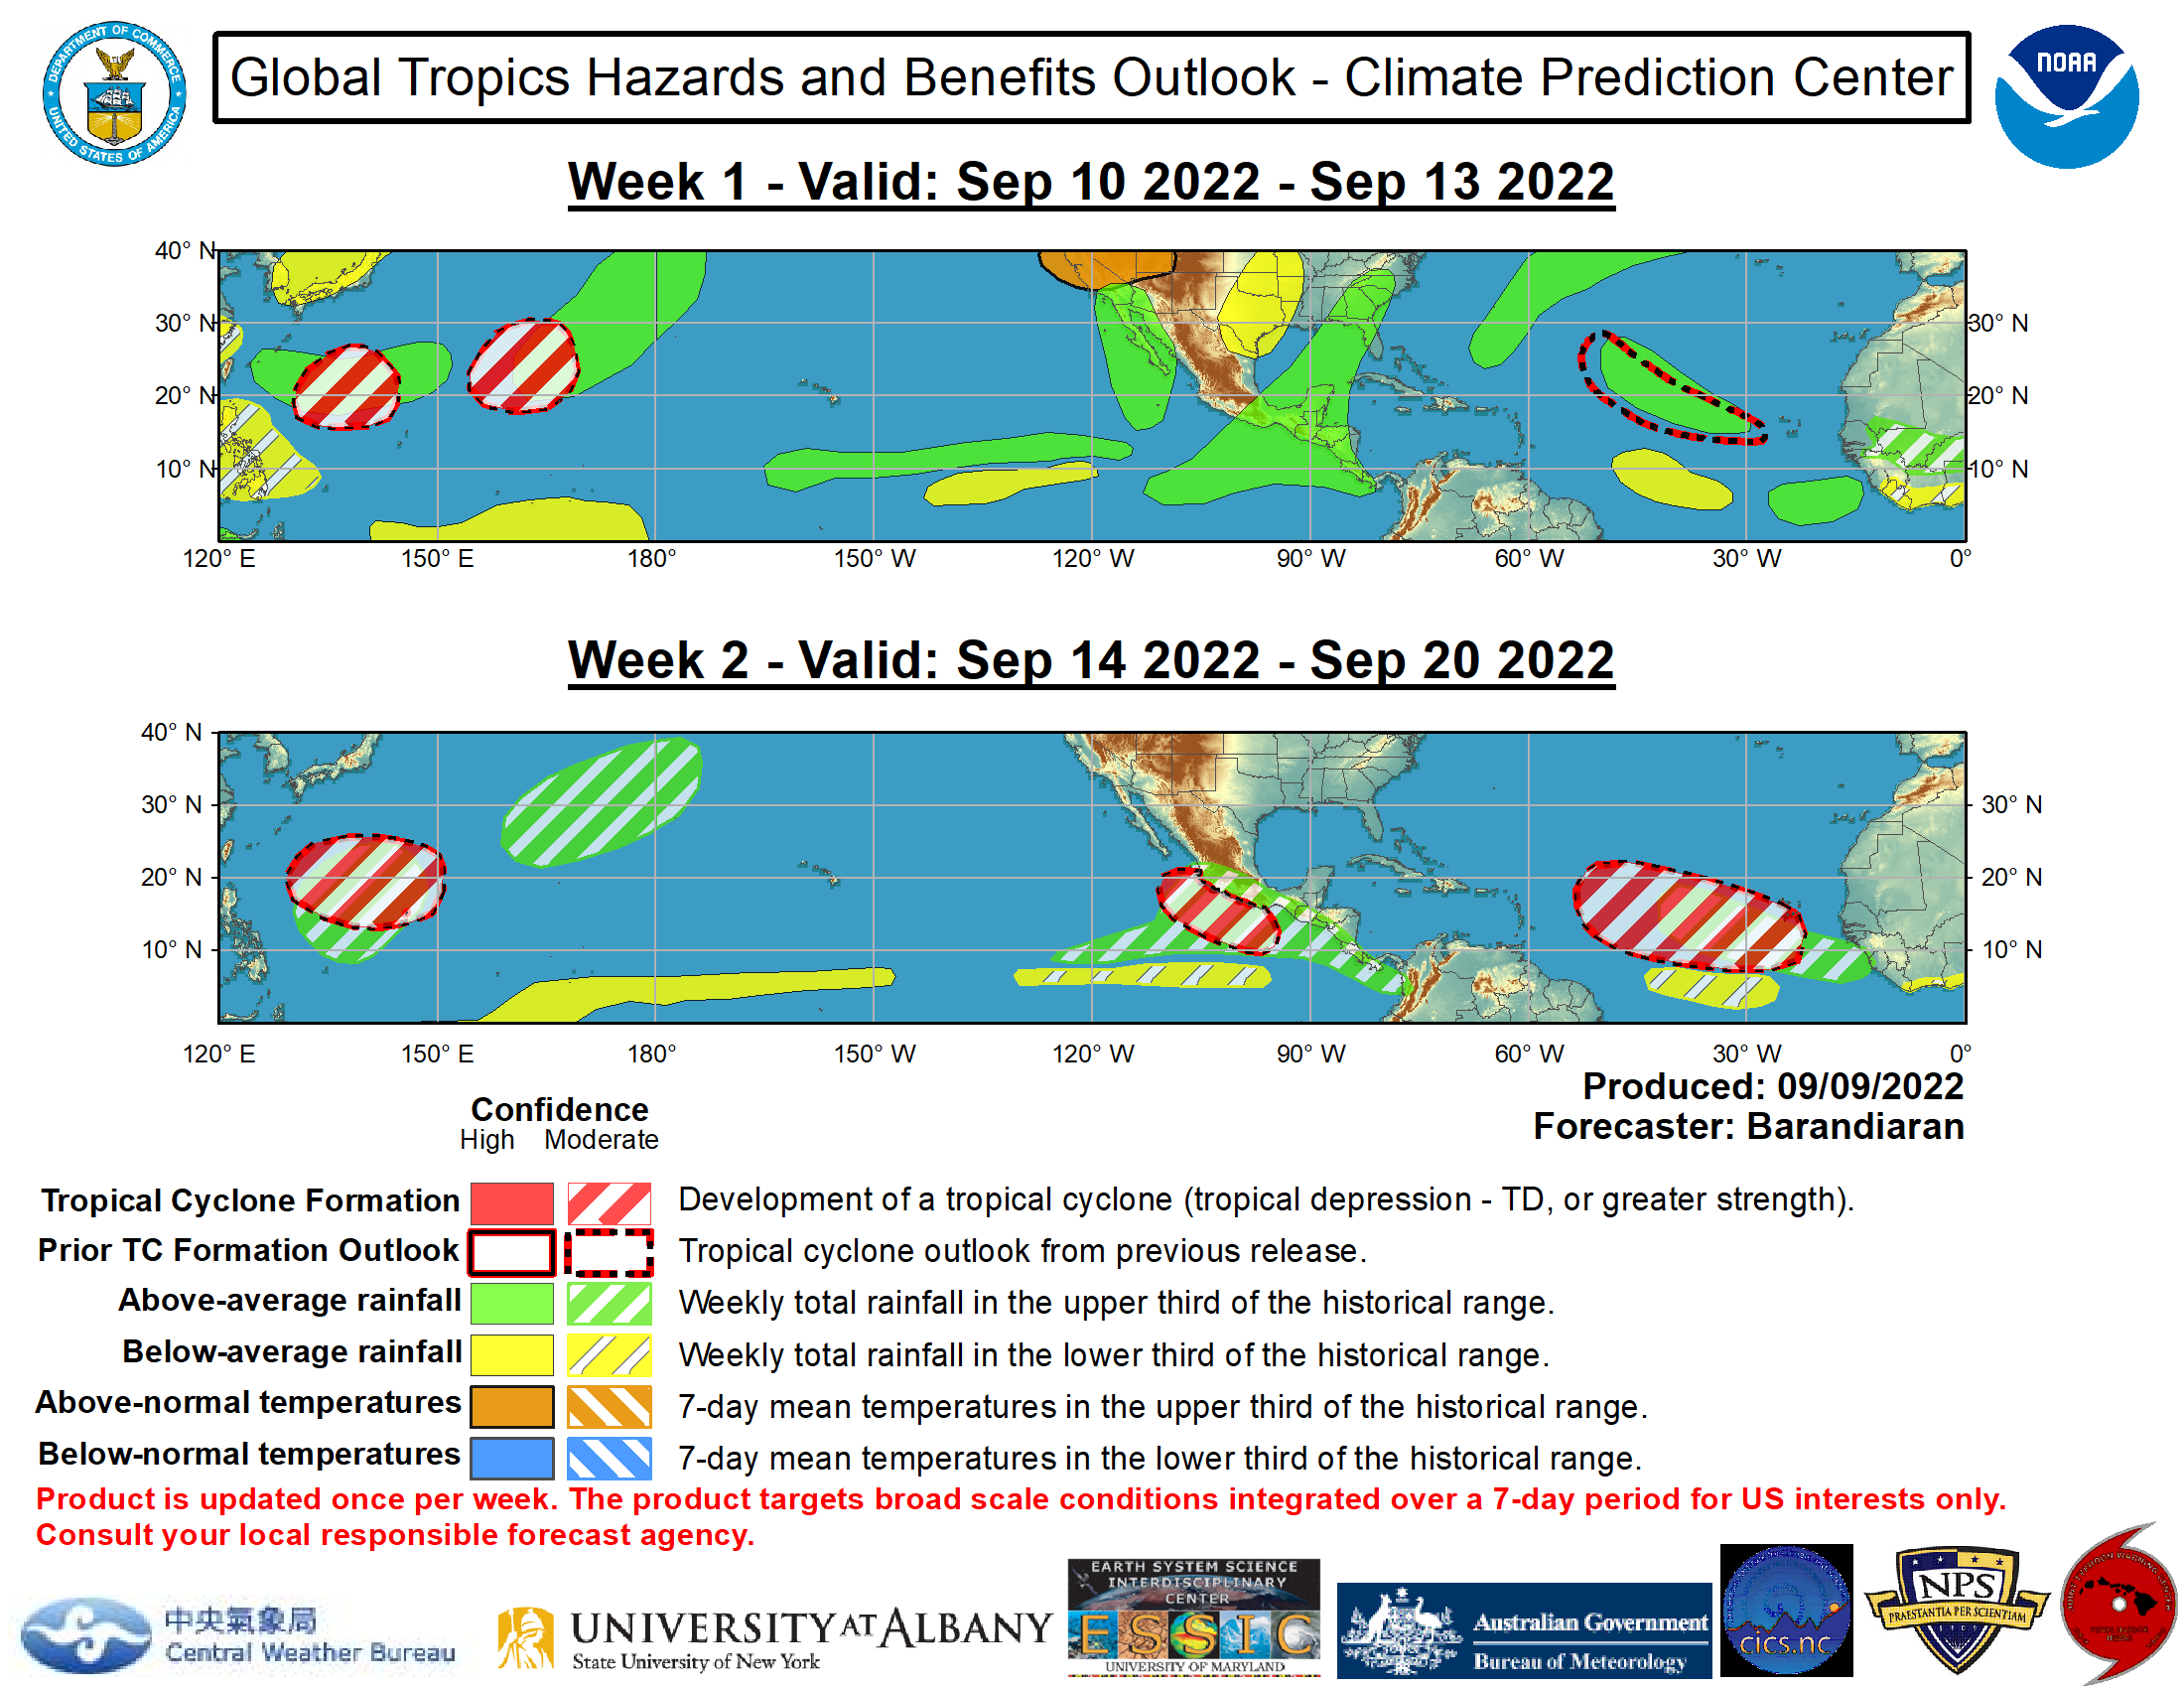
Global Tropics Outlook
 NOAA 0-24 hour TC Formation Probability
  NOAA 0-48 hour TC Formation Probability
  VIEW ALL TC PROBABILITY RUNS
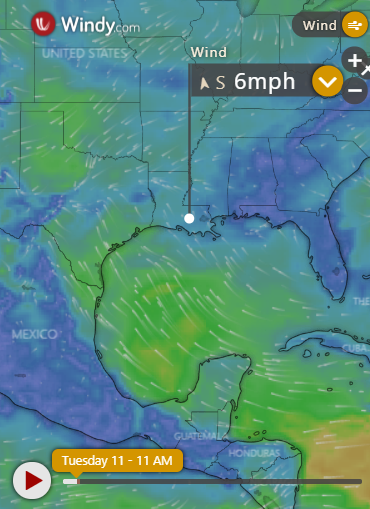
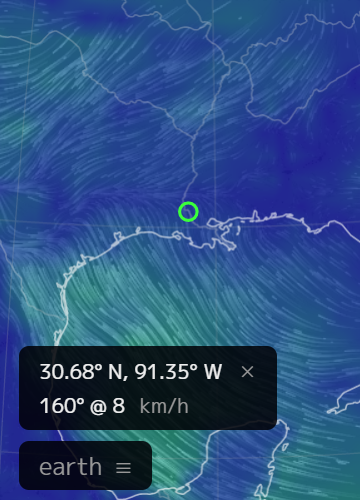
Live Current and Future Winds
 Live Ocean Currents
 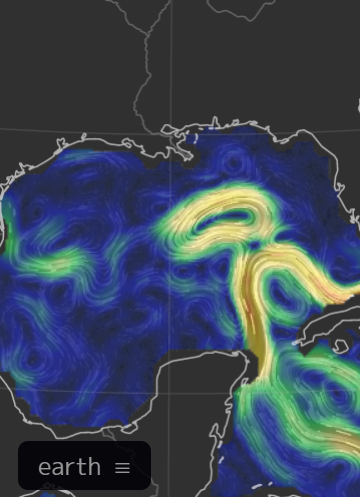 Current Tropical Surface Analysis Maps
Tropical Atlantic
 Southwest Atlantic
  Gulf of Mexico
  Southeast US Coast
  Caribbean

Gulf Of Mexico


24 hour

48 hour

72 hour

 0-120 Hours
  120-240 Hours
  Ensemble-based Probability (%) of TC Genesis Consensus (NCEP) 0-48 Hours
  0-120 Hours
  120-240 Hours
  12Z Runs of TC Genesis Probability Ensemble-based Probability (%) of TC Genesis Consensus (NCEP, CMC and ECMWF) 0-48 Hours
  0-120 Hours
  120-240 Hours
  Ensemble-based Probability (%) of TC Genesis Consensus (NCEP) 0-48 Hours
  0-120 Hours
  120-240 Hours
June
 July
July August
 September
 October
 November
![[Map of return period in years for hurricanes passing within 50 nautical miles]](http://www.nhc.noaa.gov/climo/images/return_hurr.jpg)
Estimated return period in years for hurricanes passing within 50 nautical miles of various locations on the U.S. Coast
![[Map of return period in years for major hurricanes passing within 50 nautical miles]](http://www.nhc.noaa.gov/climo/images/return_mjrhurr.jpg)
Estimated return period in years for MAJOR passing within 50 nautical miles of various locations on the U.S. Coast
 Central Gulf Coast Radar Loop
 Eastern Gulf Coast Radar
 East Coast Radar
 Northeast Coast Radar


850mb
700mb


12 Hour Forecast

24 Hour Forecast

48 Hour Forecast

72 Hour Forecast


 Southeast Coast Buoy Data
 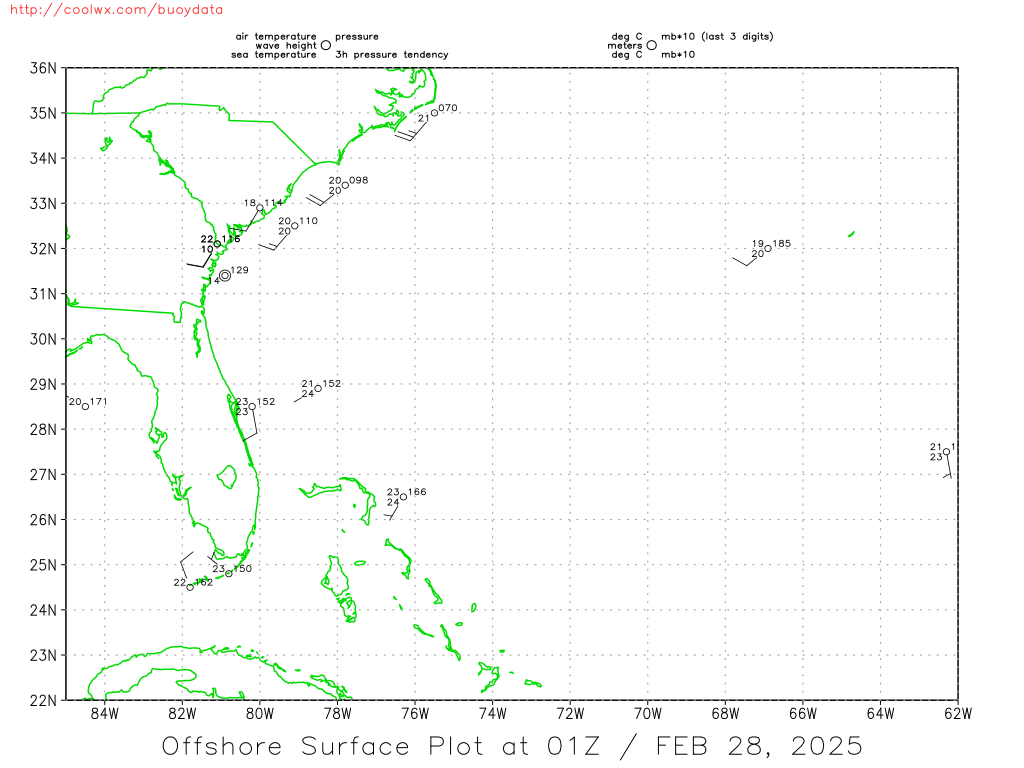 Caribbean Buoy Data
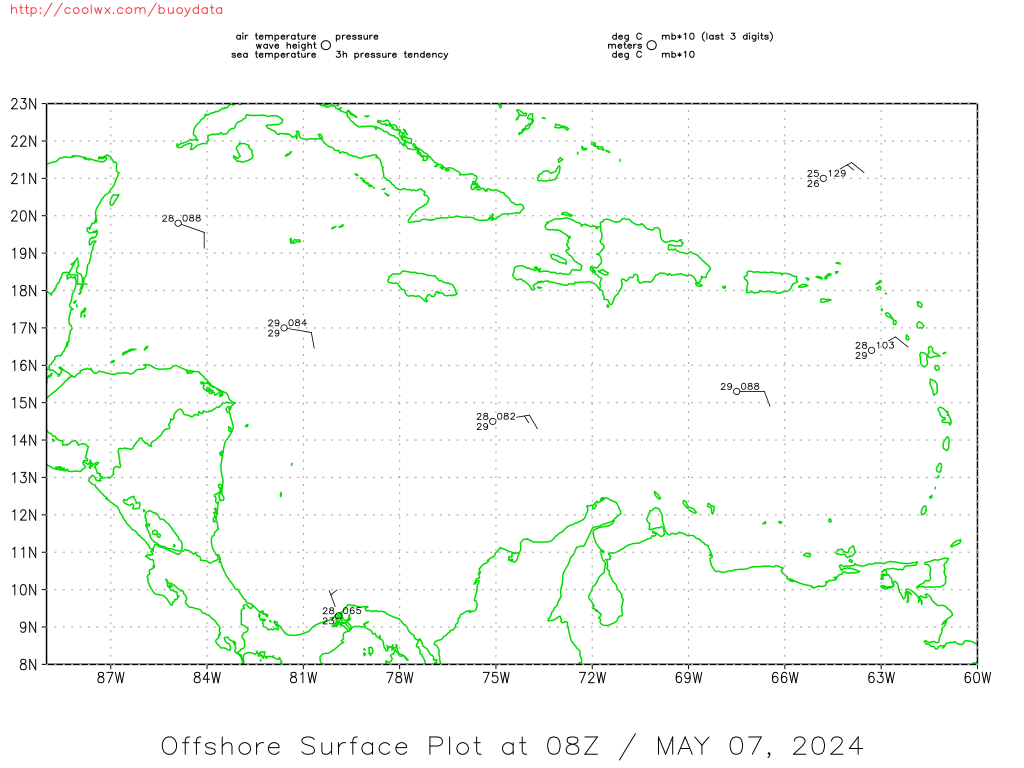
Atlantic Tropical Cyclone Activity
Quick Glance At The Tropics

Current Tropical Atlantic Analysis
Other Analysis Graphics
3 Day Loop
 Current Day 1 (Today)
  Current Day 2 (Tomorrow)
  Current Day 3
 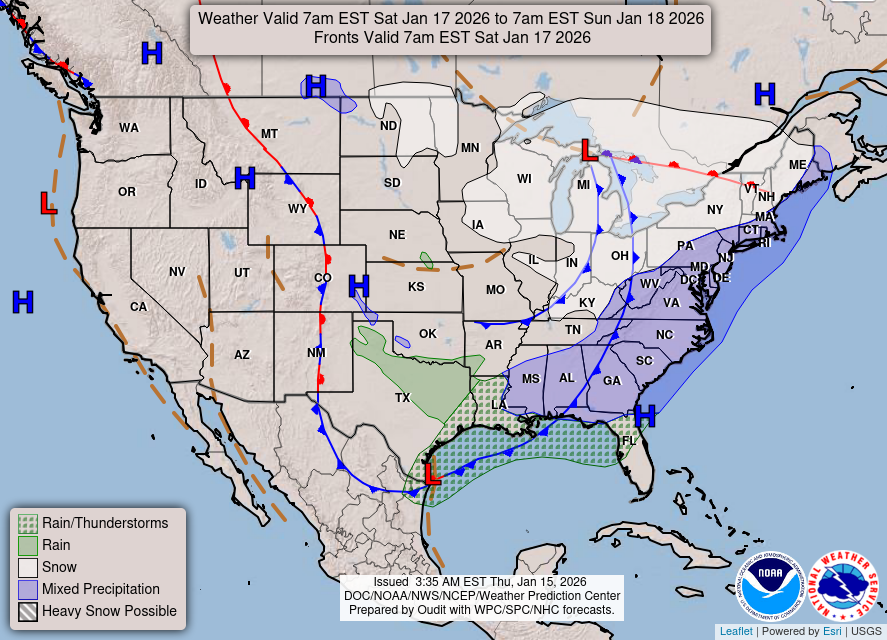 Days 3 thru 7
24 Hour NHC Forecast
48 Hour NHC Forecast

72 Hour NHC Forecast

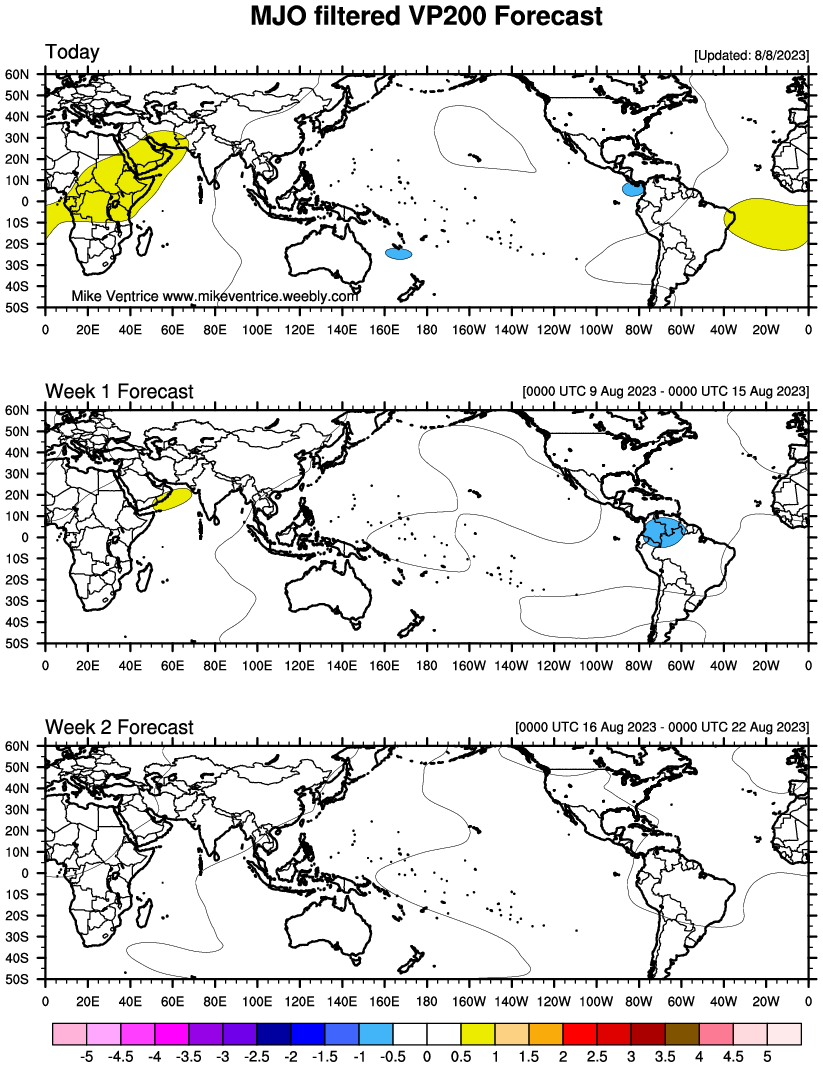
MJO Extended Forecast
GEOColor IR


Water Vapor

Infrared

Total Precipitable Water
GEOColor IR


IR

Visible

Water Vapor

GEOColor IR

Shortwave IR

Visible

Water Vapor

GEOColor IR

Infrared

Visible

Water Vapor

DISCLAIMER: This website, TrackTheTropics.com, is for general information only and not to be used for any official forecast. This site is made to provide as many useful links and information possible for hurricane tracking and knowledge. Please first consult the NWS and NHC before making decisions on any kind of weather event. We are also not responsible for inaccurate maps or data on this page.
Powered by WordPress & Atahualpa
54 queries. 0.239 seconds.
 WINTER:
WXForecasting.com - UPPER AIR SOUNDING REPORT
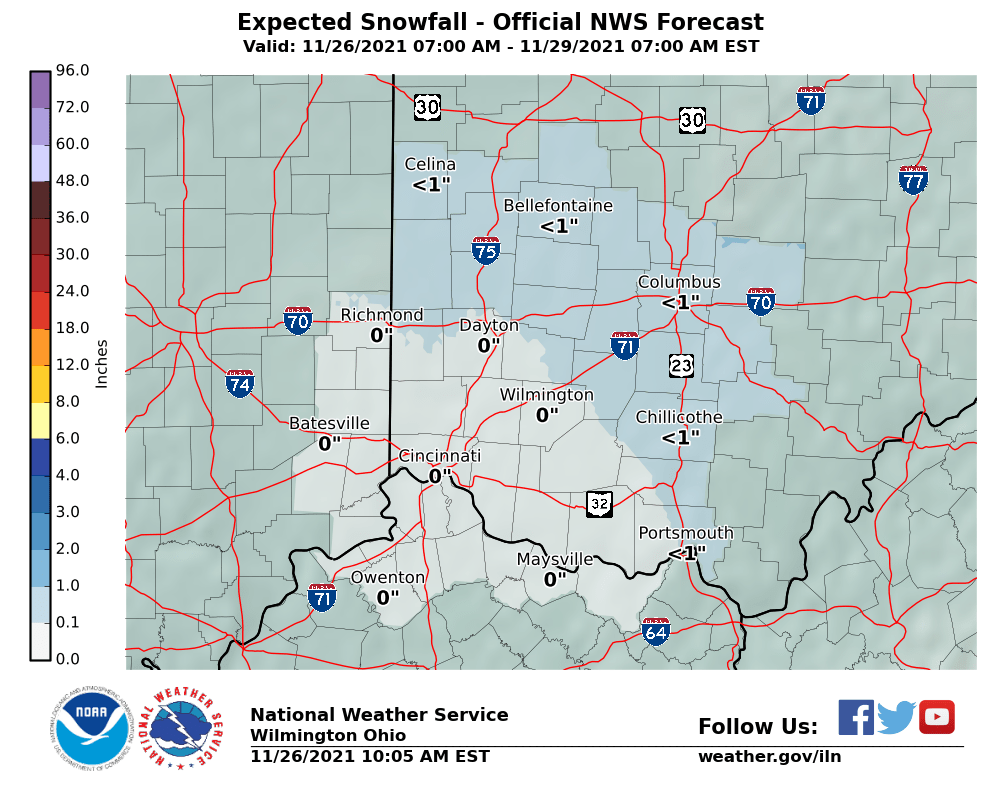
6-Hourly Snowfall Forecasts for Next 2 Days
(in inches; click map for all 48 hours at 6 hour intervals) 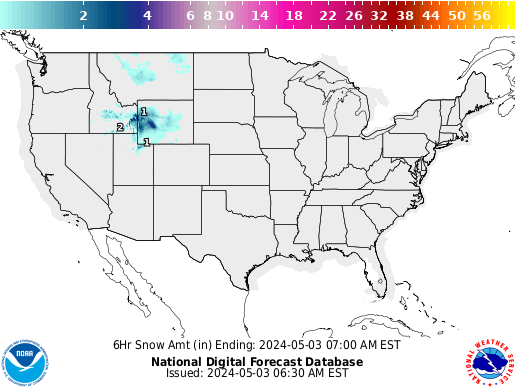
6-Hourly Snowfall Forecasts by State
| Alabama Alaska Arizona Arkansas Colorado Connecticut Delaware Florida Georgia Idaho Illinois Indiana Iowa Kansas Kentucky Louisiana Maine |
Maryland Massachusetts Michigan Minnesota Mississippi Missouri Montana Nebraska Nevada New Hampshire New Jersey New Mexico New York North California North Carolina North Dakota |
Ohio Oklahoma Oregon Pennsylvania Rhode Island South California South Carolina South Dakota Tennessee East Texas West Texas Utah Vermont Virginia Washington West Virginia Wisconsin Wyoming |
NWS DATA
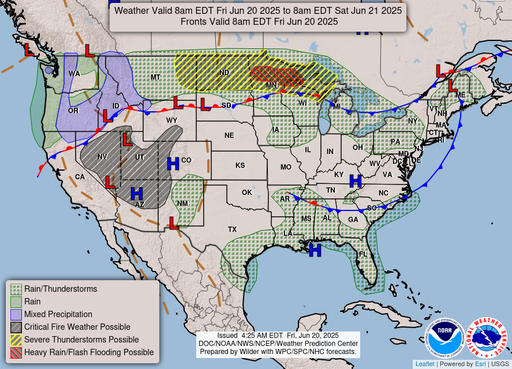
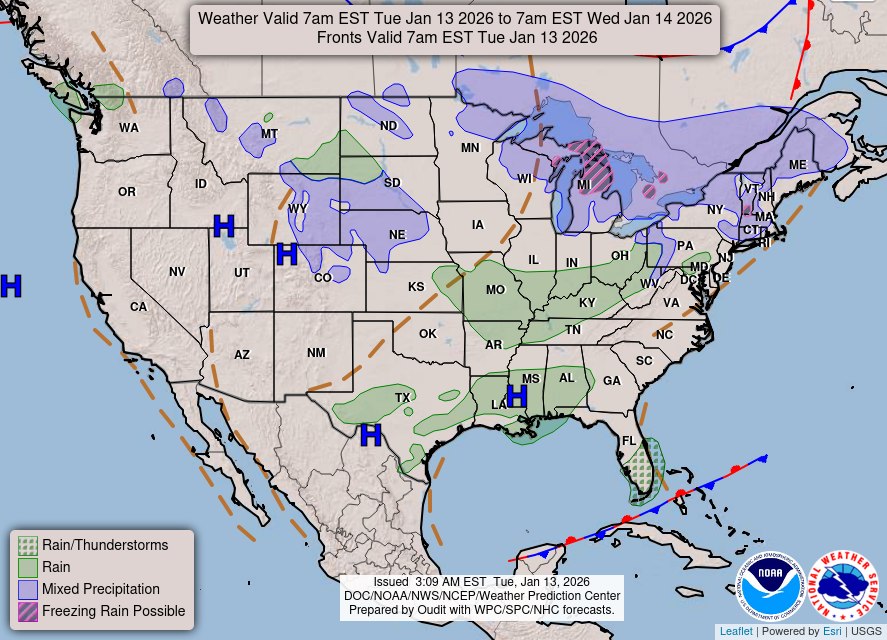
National Forecast Chart
High Resolution Version | Previous Days Weather Maps
Animated Forecast Maps | Alaska Maps | Pacific Islands Map
Ocean Maps | Legend | About These Maps

National Temperature
Alaska | Hawaii | Guam | Puerto Rico/Virgin Islands
More from the National Digital Forecast Database
Short Range Forecasts
Short range forecast products depicting pressure patterns, circulation centers and fronts, and types and extent of precipitation.
Medium Range Forecasts
Medium range forecast products depicting pressure patterns and circulation centers and fronts

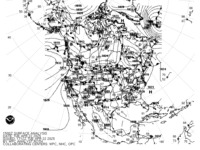
Surface Analysis
Highs, lows, fronts, troughs, outflow boundaries, squall lines, drylines for much of North America, the Western Atlantic and Eastern Pacific oceans, and the Gulf of Mexico.
Standard Size | High Resolution
Temperature
WPC Probabilistic Winter Precipitation Guidance
Maximum daytime or minimum overnight temperature in degrees Fahrenheit.
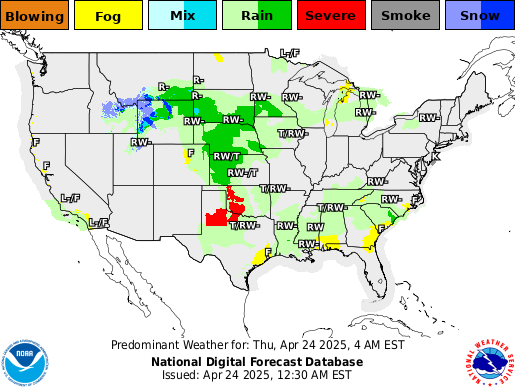
Predominant Weather
Expected weather (precipitating or non-precipitating) valid at the indicated hour. The weather element includes type, probability, and intensity information.
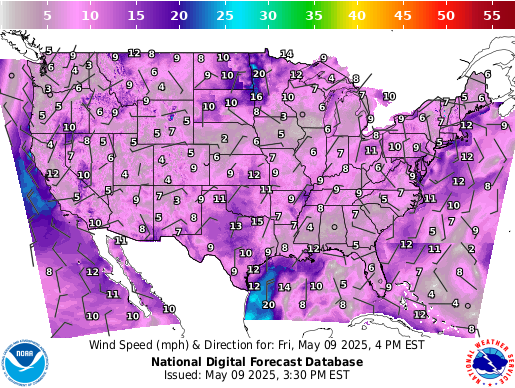
Wind Speed and Direction
Sustained wind speed (in knots) and expected wind direction (using 36 points of a compass) forecasts.
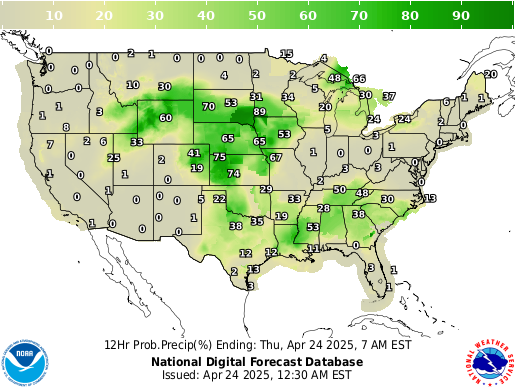
Chance of Precipitation
Likelihood, expressed as a percent, of a measurable precipitation event (1/100th of an inch).
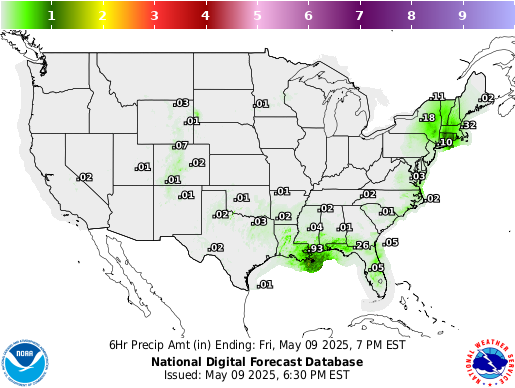
Precipitation Amount
Total amount of expected liquid precipitation.
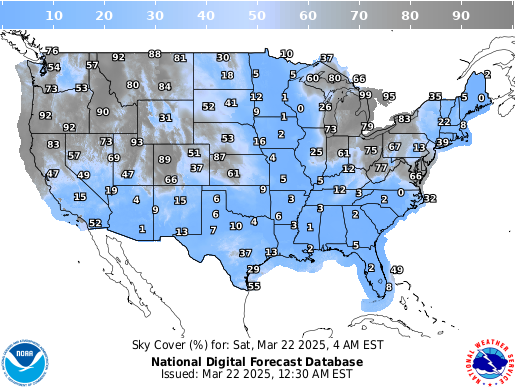
Sky Cover
Expected amount of opaque clouds (in percent) covering the sky.
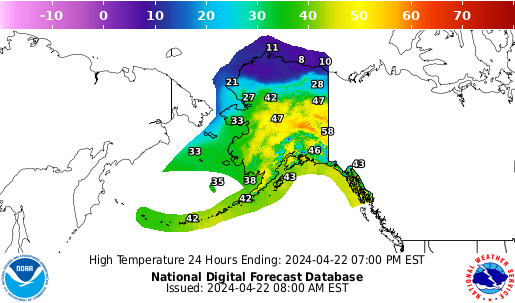
Alaska Graphical Forecasts
Graphical forecasts from the National Digital Forecast Database for Alaska.
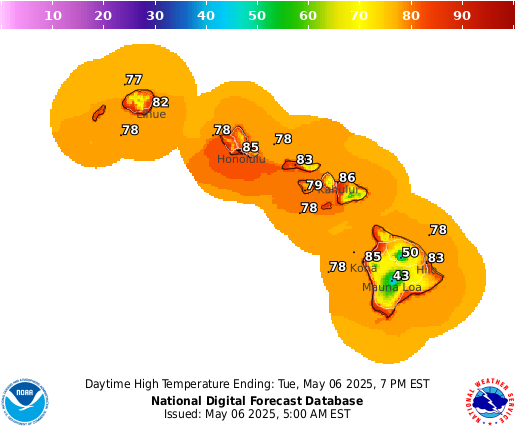
Hawaii Graphical Forecasts
Graphical forecasts from the National Digital Forecast Database for Hawaii.
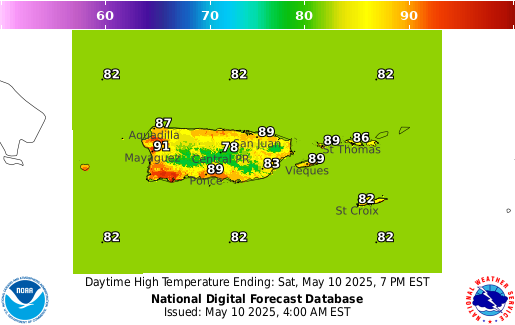
Puerto Rico Graphical Forecasts
Graphical forecasts from the National Digital Forecast Database for Puerto Rico and Virgin Islands.
Facebook Comments