Cincinnati and U.S. Weather Lab

Forecast for any place in the Country.


"Weather is All Around Us...."


Article Index

Model Data


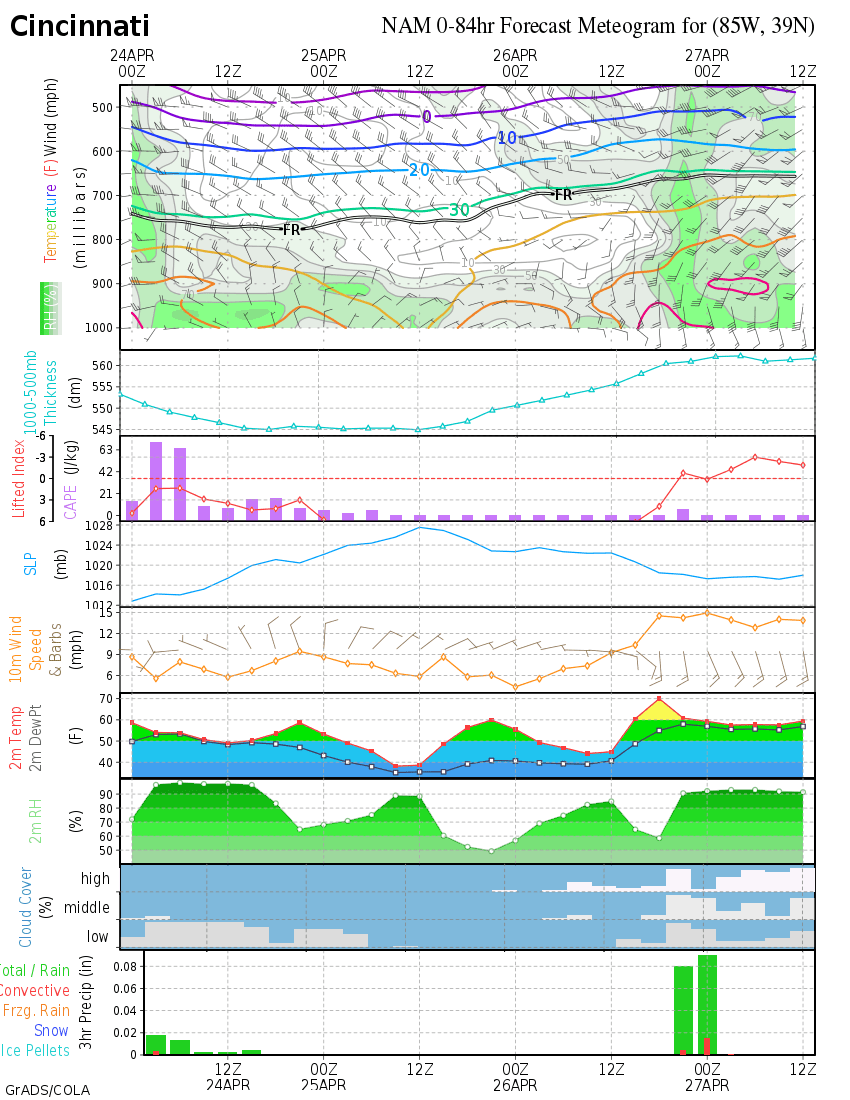
Cloud And Precip 3-Day Forecast
(NAM 3-Hrly) CLICK IMAGE

Temperature 3-Day Forecast
(NAM 3-Hrly) CLICK IMAGE


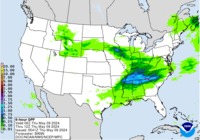
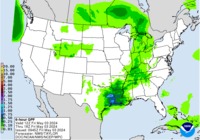
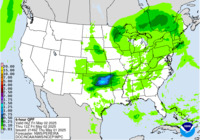
Cloud And Precip 10-Day Forecast
(GFS 6-Hrly) CLICK IMAGE

Jet Stream 10-Day Forecast
(GFS 6-Hrly) CLICK IMAGE


Statistical Modeling Branch

 Live Model Data: 


  US Drought Monitor


Regional (station means, histories, etc)
Western Regional Climate Center and historical climate data
High Plains Regional Climate Center
Midwest Regional Climate Center
Northeast Regional Climate Center
Southern Regional Climate Center
Southeast Regional Climate Center

Lawn and garden climate zones

Historical climate indices:

 ENSO Index(El Nino/La Nina)

 PDO (Pacific Decadal Oscillation)

 NAO (North Atlantic Oscillation)

 Storm Page (Summer/Winter)

This area is used for all severe weather, not just in the Spring and Summer months, but in the Winter months as well.  You will need to refresh your browser to see the latest information.

General (Overall), severe thunderstorms, tornadoes, hail, etc overview.

Full screen radar

 SPC Products Overview  


North American Surface Analysis
Hourly Surface Data for the Continental U.S.
View the National Weather Service Unified Surface Analysis
WPC's Surface Analysis Archive
Surface analyses in jpeg format


Severe Weather Parameters (KCVG) Model Weather Parameters (KCVG)
HRRR Text Extraction
WRF Text Extraction
NAM Text Extraction
06 AND 18Z Text Extraction
40km NAM Text Extraction
40km 06 and 18Z NAM Text Extraction
5km WRF Text Extraction
40km NAM Severe Text Extraction
40km RUC Severe Text Extraction
40km RAP Text Extraction
1 Deg GFS Text Extraction
1 Deg GFS 06 and 18Z Text Extraction
MRF Text Extraction
SREF Prob Extraction
1 deg GFS Sfc Text Extraction
1 deg 06 or 18Z GFS Sfc Text Extraction
40km NAM Sfc Text Extraction
40km NAM 06 and 18Z Sfc Text Extraction
0.25 Deg GFS Text Extraction
0.25 Deg GFS Sfc Text Extraction
0.5 Deg GFS Sfc 06 and 18Z Text Extraction
0.5 Deg GFS 06 and 18Z Text Extraction
12km NAM Text Extraction
Stage 4 24hr Accum Precip Extractions
Model Meteograms:
0.25 Deg GFS Cross section and Meteogram
7 day 0.25 Deg GFS Cross section and Meteogram
40km NAM Cross section and Meteogram
40km RAP Cross section and Meteogram
06 and 18Z 0.5 Deg GFS Cross section and Meteogram
HRRR Cross section and Meteogram
CFS V2 9 Month Meteogram
CFS V2 Seasonal Meteogram
CFS V2 45day Meteogram
Stage 4 24hr Precip Meteogram
Stage 4 24hr Precip Meteogram for 2012
Stage 4 24hr Precip Meteogram for 2013
Stage 4 24hr Precip Meteogram for 2014
Stage 4 24hr Precip Meteogram for 2015
Stage 4 24hr Precip Meteogram for 2016
Stage 4 24hr Precip Meteogram for 2017
Stage 4 24hr Precip Meteogram for 2018
Stage 4 24hr Precip Meteogram for 2019
Stage 4 24hr Precip Meteogram for 2020
Stage 4 24hr Precip Meteogram for 2021
Model Comparison Graphs
Newer Model Skew-T Loops:
24hr RUC Skew-T Loop to current hour
5km WRF Loop
12km NAM Skew-T Loop hourly to 36hr
40km NAM Skew-T Loop
40km 06 and 18Z NAM Skew-T Loop
1 deg GFS Skew-T Loop
40Km RUC Skew-T Loop


Current Surface Analysis

[current sfc analysis]
Click on above map for full view.
[Black and White Image]

North America / Without Surface Observations
[Color]        [B/W]

Continental U.S. (CONUS)

With Surface Observations: [Color]    [B/W]    [B/W Print Version]*
Without Surface Observations:    [Color] [B/W]


With Surface Observations: [Color]    [B/W]    [B/W Print Version]*
Without Surface Observations:    [Color] [B/W]
North American Surface Analysis

Hourly Surface Data for the Continental U.S.
View the National Weather Service Unified Surface Analysis

WPC's Surface Analysis Archive
Surface analyses in jpeg format


Current Surface Analysis

North America / With Surface Observations
[current sfc analysis]
Click on above map for full view.
[Black and White Image]

North America / Without Surface Observations
[Color]        [B/W]

Continental U.S. (CONUS)

With Surface Observations: [Color]    [B/W]    [B/W Print Version]*
Without Surface Observations:    [Color] [B/W]

   Upper Air: 925mb, 850mb, 700mb, 500mb, 250mb, SPC analyses, SPC Soundings, 5-day NH loop

SOURCE MB HEIGHT
                 
PSU ---- H85 H7 H5 H3 ----- ---- -------
NCAR ---- H85 H7 H5 H3 H25 H2 -------
CMC ---- H85 H7 H5 ---- H25 ---- -------


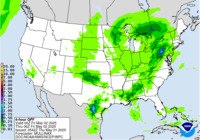
24 Hour Precipitation Total - Day 1

Day 1 QPF
Day 1 QPF
[contours only]

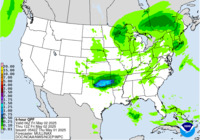
6 Hourly Precipitation Amounts - Day 1

Update (00-06 hr QPF) Update (00-06 hr)
[contours only]
06-12 hr QPF 06-12 hr.
[contours only]
12-18 hr QPF 12-18 hr.
[contours only]
18-24 hr QPF
18-24 hr.
[contours only]
24-30 hr QPF
24-30 hr.
[contours only]


 National Weather Service River Forecast Centers

REGIONAL PRECIPITATION 


CPC Extended Temp Outlook

Drought Monitor

24-hr Temp Change

From the Storm Prediction Center (SPC):


                      Day1                                                  Day2                                             Day 3

Mesoscale Discussion MD
IEM V-Tec App VTec App
Lightning Maps.org LMaps
SPC Mesoscale Analysis SPC MA
Current Surface Features Surface
Wundermap WUM
GOES Imagery Viewer GOES Satellite


                Cooperative Institute for Precipitation Systems (CIPS) Map DATA 

Day 1 (F024) Day 2 (F048) Day 3 (F072) Day 4 (F096) Day 5 (F120) Day 6 (F144) Day 7 (F168) Day 8 (F192)

                                     CIPS MAP Day 1                                                    CIPS MAP Day 8                                                                        


Spacer
Current U.S. SPC Activity Chart
spacer Valid MD Image
Latest U.S. Mesoscale Discussion
spacer Spacer
Current U.S. Mesoscale Discussions
spacer MD 442 graphic
U.S. Convective Watches
spacer Todays U.S. Storm Report
Todays U.S. Severe Storm Report
spacer U.S. Annual Severe Weather Report Summary
U.S. Year to Date Severe Weather Report


USGS Flooding

Drought Monitor

Air Quality

UK Agricultural Weather Center

-CIPS Experimental Analog-Based Severe Probability Guidance

-Tornado HQ


Lightning:

Around the United States:  Lightning Maps