
Like me on Facebook:
Sharonville, OH & US Weather
Follow me on X:

WWebmaster: Dr. Michael Moyer, Ph.D. can be reached at This email address is being protected from spambots. You need JavaScript enabled to view it. 


Powered by: Our Proud Sponsors!mik
 |
 |
 |
  |
  |
|


|
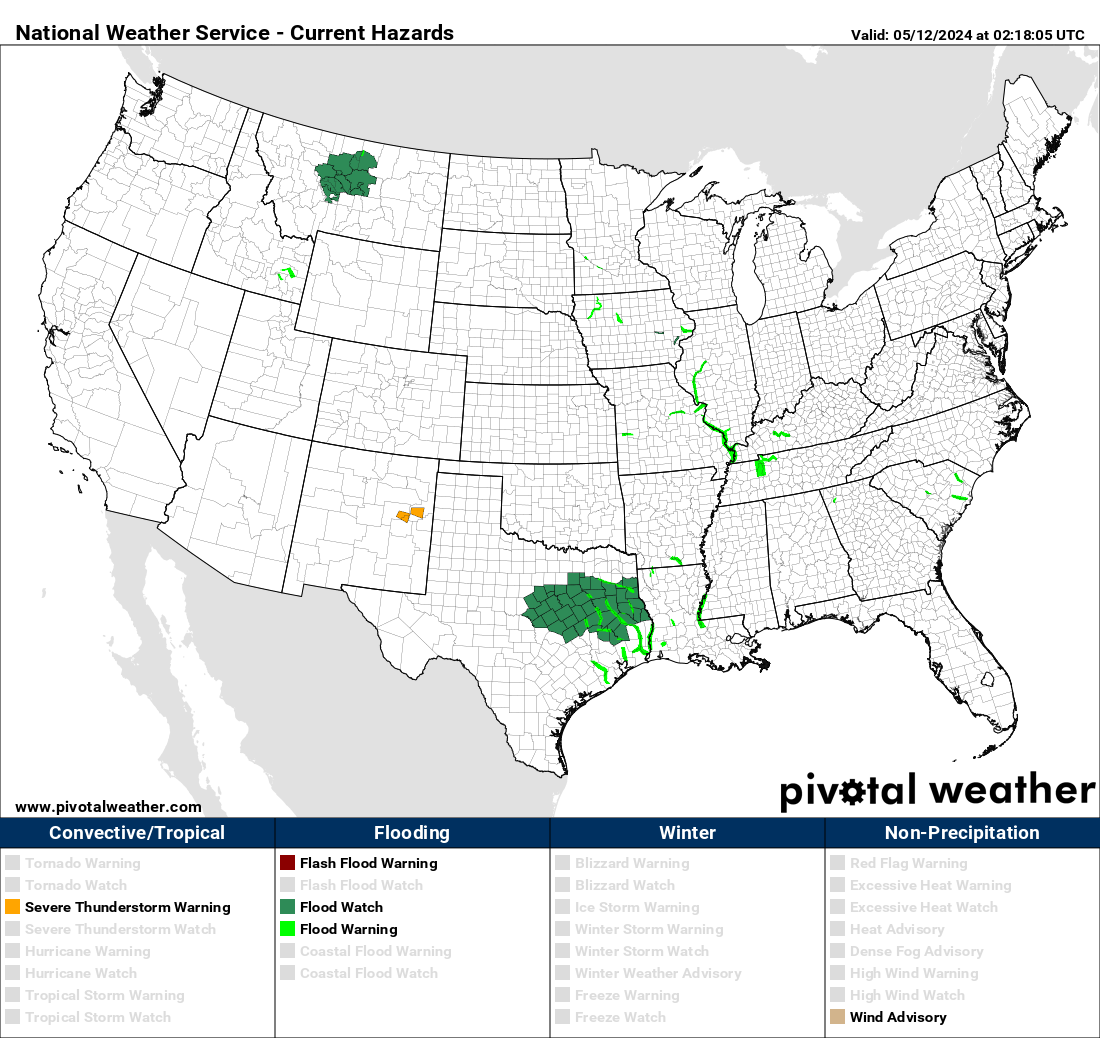
Your Local NWS Alerts Map: Click map then your area.
Quick 500mb level check temperatures
|
The Next 12 Days Forecast:
Day 4-8 Storm Outlook:
|


|
Track the Tropics!
|
||||||||||


|
|
|
Weather Station Data from Dr. Moyer's Wx station in Sharonville OH (Hamilton Co) |
Weather maps around the US: (Courtesy WeatherRoanoke).
 |
|
1SE Sharonville OH (Hamilton Co) (these are updated every 10 mins.) |
Who uses this Sharonville Data?
1) CWOP - Citizens Weather Observation Program ⇑ 
2) APRSWXNET - Automatic Position Reporting System as a WX NETwork.
3) Local NWS Office - KILN
4)  Community Collaborative Rain, Hail & Snow Network (CoCoRaHaHS)
5) Forecasting Model Data. = Finally, the more data that can be verified and sent to NOAA helps solidify the model and progress throughout the day strengthening of the entire model making it much more reliable of a forecast.
6) CWOP - Citizens Weather Observation Program Search Tool
8) Local News Media (TV, Radio & Electronic Media)
9) Reconstruction of accidents
**************************************************************************************************
CONUS Radar
Quick Midwest Look

Initial Weather Situational Maps Awareness
|
|
Surface Maps | Jet stream; Satellite; Temps; Radar; 48hr Forecast |
 |
 |
 |
 |
|
 |
 |
 |
 |
 |
*****************************************************************************************
Hourly surface observations for the past 24 hours |
|||
| 00 UTC Low High |
06 UTC Low High |
12 UTC Low High |
18 UTC Low High |
| 01 UTC Low High |
07 UTC Low High |
13 UTC Low High |
19 UTC Low High |
| 02 UTC Low High |
08 UTC Low High |
14 UTC Low High |
20 UTC Low High |
| 03 UTC Low High |
09 UTC Low High |
15 UTC Low High |
21 UTC Low High |
| 04 UTC Low High |
10 UTC Low High |
16 UTC Low High |
22 UTC Low High |
| 05 UTC Low High |
11 UTC Low High |
17 UTC Low High |
23 UTC Low High |
(Unofficial) Record-breaking temperature across the Globe.
|
||||||

⇑ ⇑
Color Codes change, so to see the correct advisory, go to: WPC
https://www.weather.gov/iln/
|
SPECIAL WX STATEMENTS/WATCHES & WARNINGS-CLICK ON LINK
|
The Next Few Days Forecast:
WPC Interactive Page Day 1-3 / Day 3-7 / Animate Day 1-7
CSU / Albany / FSU / PSU / BurgWX / Polar
Cyclonicwx / DuPage / Fox / McNoldy
Weather / Tropical Tidbits / Weathernerds
Maps:
WPC Interactive Page Day 1-3 / Day 3-7 / Animate Day 1-7
Weather Viewer: Situational Awareness (Click on link)

(Cincinnati to the far right of your screen)
Weather Map in motion Interactive National Radar
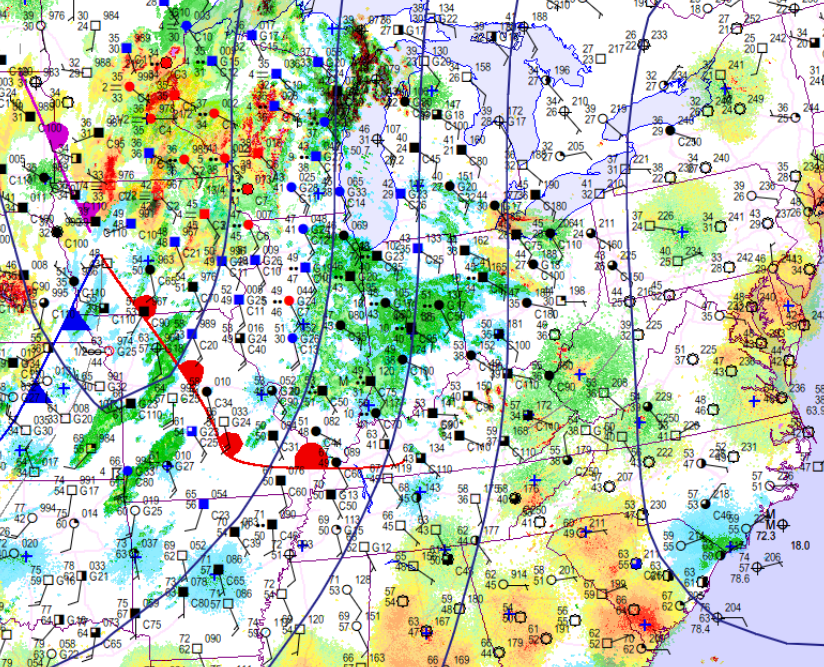
H500 Surf Dwpt/Frontal Positions
 |
 |
|
|
|
|
 |


7-days in 7 seconds
Interactive Radar: (Make your own)


Satellite
Infrared Ohio Valley Satellite


- Global & Hemispheric Products
- Global Infrared Satellite Composite (Courtesy of SSEC)
- National Products
- US Infrared Satellite Image (Courtesy of SSEC)
- US Visible Satellite Image (Courtesy of SSEC)
- US Water Vapor Satellite Image (Courtesy of SSEC)
30-Day Temperature Outlook

90-Day Temperature Outlook

30-Day Precipitation Outlook

90-Day Precipitation Outlook
River Observations & Forecasts
Maps Superimposed on GOES Imagery
NH Surface Temperatures (5° increments)
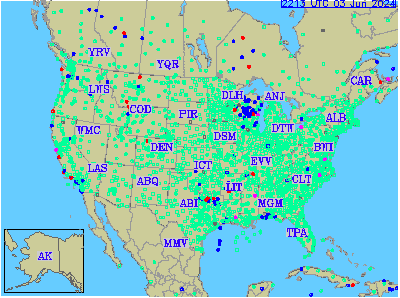
Sounding and Meteogram Data across the US
| Meteogram Generator (CVG) |
 |
Aviation Briefing (not for flight planning) |
 |
|
US satellite: Click on OH, IN, KY to show motion. Click on US satellite to go to the full US motion page.
************************************************************************************
| Get Your SKEW-T / #2 Skew-T / #3 Skew-T / #4 Skew-T Meteogram Generator (CVG) (CVG) |
Upper Air Maps - current, unanalyzed, and archived maps from SPC
Upper Air Data - upper air maps, soundings, and wind profiler information from NCAR
Soundings - upper air soundings from across the United States from SPC
SPC Mesoanalysis - real-time objectively analyzed maps from SPC, with a focus on severe weather parameters
Composite Map - interactive map where you can overlay several different weather maps
NWS Weather Prediction Center - Mesoscale Precipitation Discussions